
Datasheet


Table Of Contents
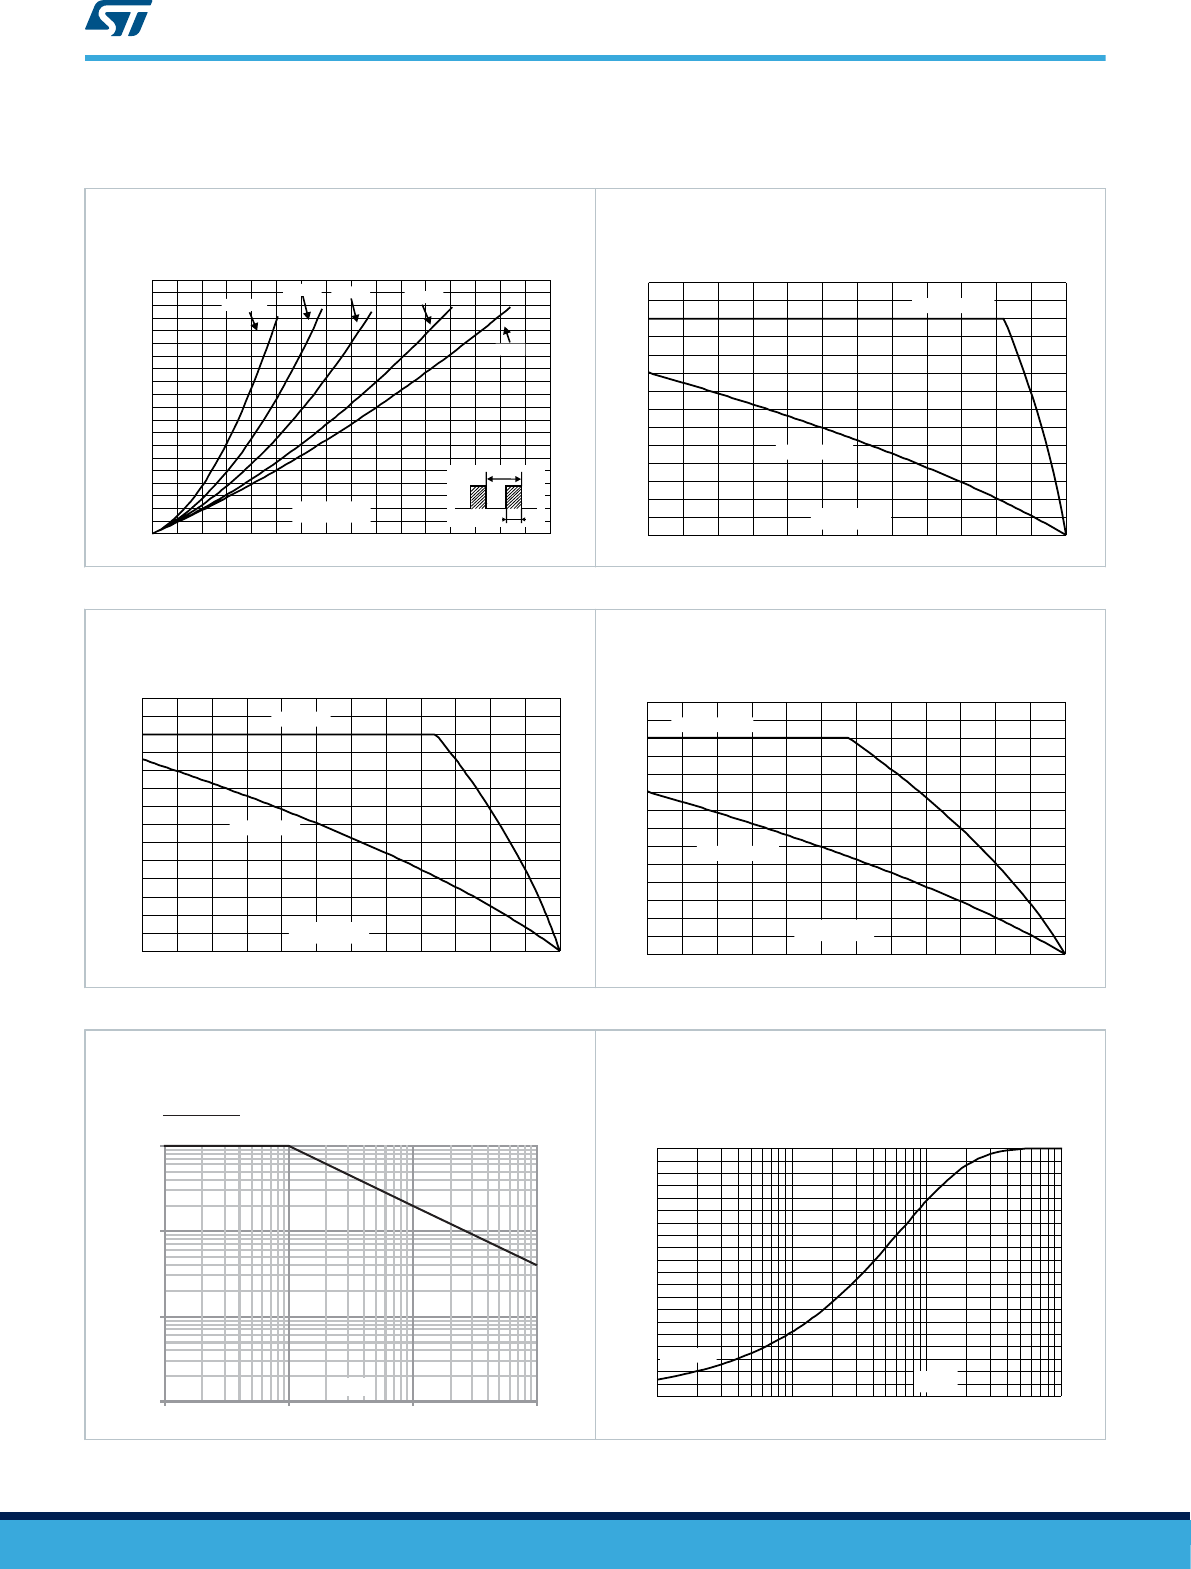
1.1 Characteristics (curves)
Figure 1. Average forward power dissipation versus
average forward current
P (W)
F(AV)
0.00
0.25
0.50
0.75
1.00
1.25
1.50
1.75
2.00
2.25
2.50
0.0 0.5 1.0 1.5 2.0 2.5 3.0 3.5 4.0
T
δ
=tp/T
tp
I (A)
F(AV)
δ = 0.05
δ = 0.1
δ = 0.2
δ = 0.5
δ = 1
Figure 2. Average forward current versus ambient
temperature (δ = 0.5) (SMB Flat, SMB Flat Notch)
0.0
0.5
1.0
1.5
2.0
2.5
3.0
3.5
0 2 5 5 0 75 100 125 150
Rth(j-a)=Rth(j-l)
Rth(j-a)=100°C/W
I (A)
F(AV)
T (°C)
amb
Figure 3. Average forward current versus ambient
temperature (δ = 0.5) (DO-201AD, SMB)
I (A)
F(AV)
0.0
0.5
1.0
1.5
2.0
2.5
3.0
3.5
0 2 5 5 0 75 100 125 150
R =80°C/W
th(j-a)
R = R
th(j-a) th(j-I)
T (°C)
amb
Figure 4. Average forward current versus ambient
temperature (δ = 0.5) (DO-15)
I (A)
F(AV)
0.0
0.5
1.0
1.5
2.0
2.5
3.0
3.5
0 2 5 5 0 75 100 125 150
Rth(j-a)=Rth(j-l)
Rth(j-a)=100°C/W
T (°C)
amb
Figure 5. Normalized avalanche power derating versus
pulse duration (T
j
= 125 °C)
P (t
p
)
P (10 µs)
ARM
ARM
0.001
0.01
0.1
1
1 10 100 1000
t (µs)
p
Figure 6. Relative variation of thermal impedance junction
to lead versus pulse duration (SMB Flat, SMB Flat Notch)
0.0
0.1
0.2
0.3
0.4
0.5
0.6
0.7
0.8
0.9
1.0
1.E-03 1.E-02 1.E-01 1.E+00
Single pulse
Z /R
th(j-l) th(j-l)
t (s)
p
STPS3L60
Characteristics (curves)
DS2134 - Rev 7
page 4/17