
Datasheet


STP16CPC26
Timing diagrams
DocID18469 Rev 6
13/28
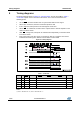
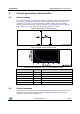
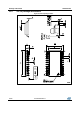
Figure 11: Timing for clock signal, serial-in and serial out data
The correct sampling of the data depends on the stability of the data at SDI on the rising
edge of the clock signal and it is assured by a proper data setup and hold time (t
SETUP1
And
t
HOLD
), as shown in Figure 11: "Timing for clock signal, serial-in and serial out data". The
same figure shows the propagation delay from CLK to SDO (t
PLH
/t
PHL
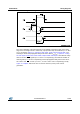
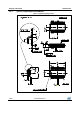
). Figure 12: "Timing
for clock signal serial-in data, latch enable, output enable and outputs" describes the setup
times for LE and OE signals (t
SETUP2
and t
SETUP3
respectively), the minimum duration of
these signals (t
WLAT
and t
WENA
respectively) and the propagation delay from CLK to OUT
n
,
LE to OUT
n
and OE to OUT
n
(t
PLH1
/t
PHL1
, t
PLH2
/t
PHL2
and t
PLH3
/t
PHL3
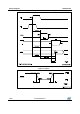
respectively). Finally
Figure 13: "Outputs" defines the turn-on and turn-off time (t
r
and t
f
) of the current
generators.