
Datasheet


1.1 Characteristics (curves)
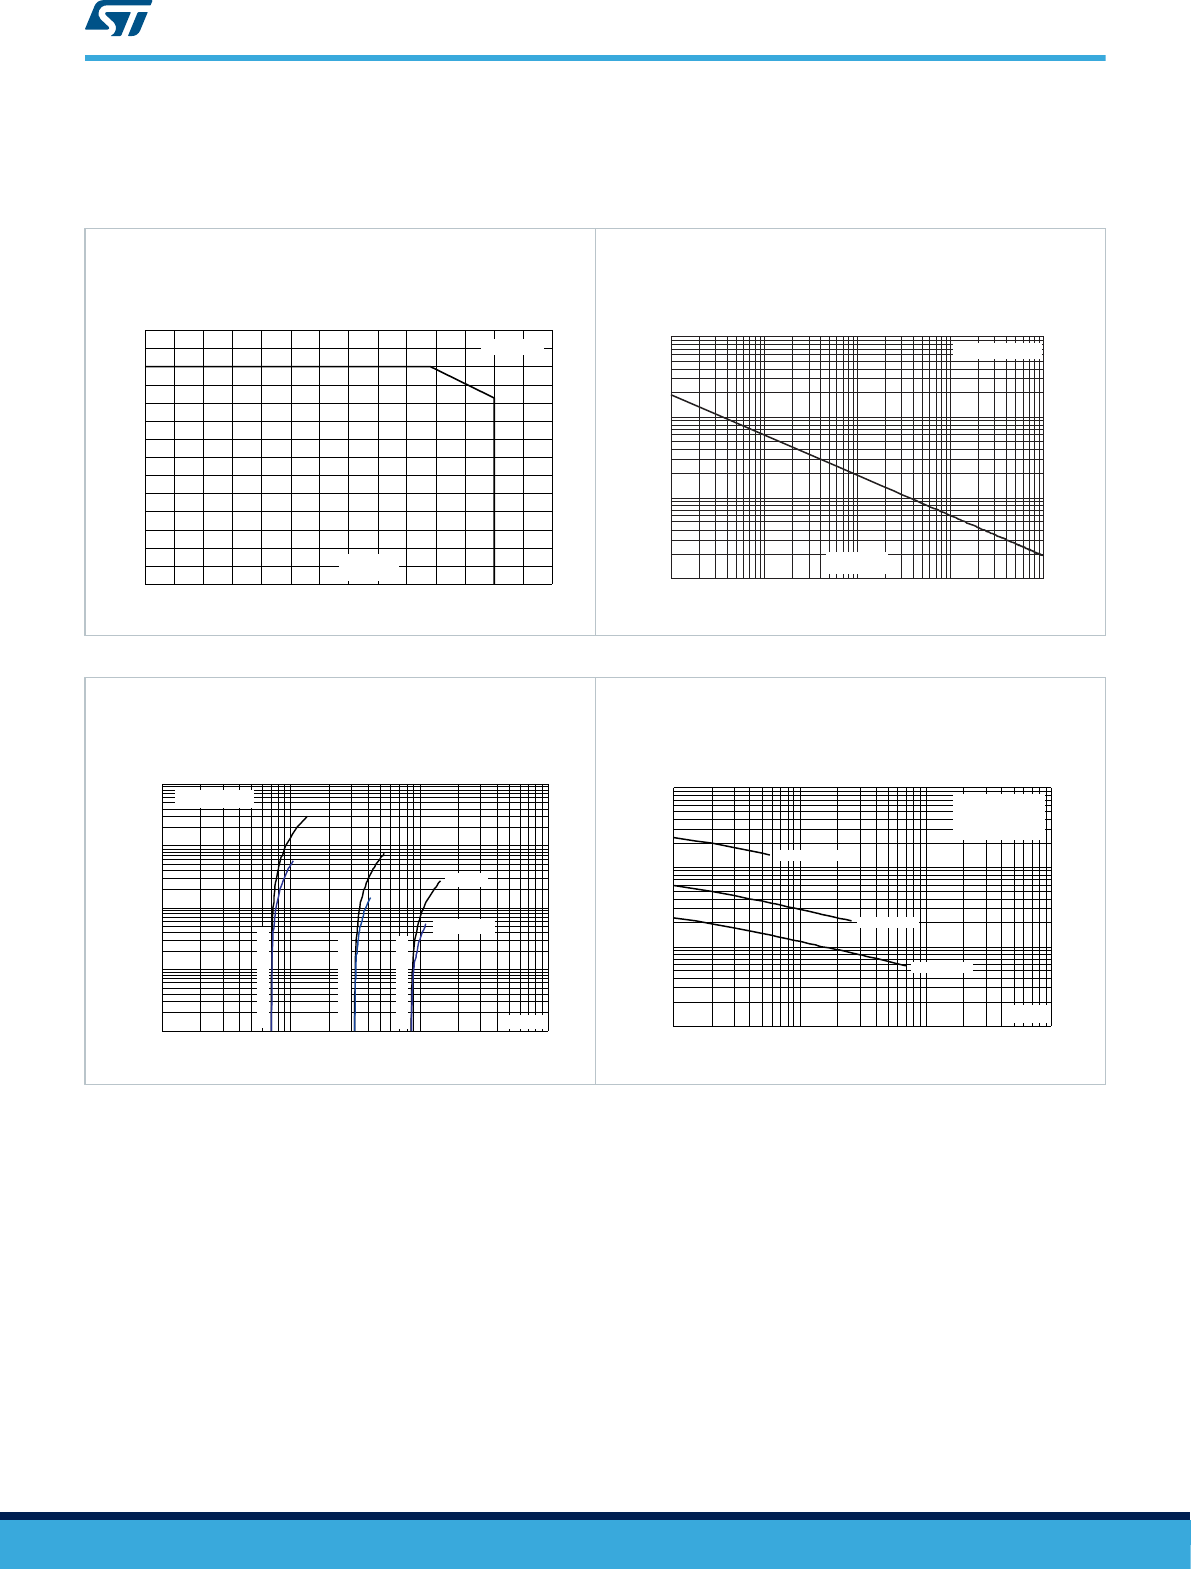
Figure 4. Maximum peak power dissipation versus initial
junction temperature
0
100
200
300
400
500
600
700
10/1000 µs
0 25 50 75 100 125 150 175
P
pp
(W)
T
j
(°C)
Figure 5. Maximum peak pulse power versus exponential
pulse duration
1
0.1
1.0
10.0
100.0
1.0E-03 1.0E-02 1.0E-01 1.0E+00 1.0E+01
P
PP
(kW)
T
j
initial = 25 °C
t
P
(ms)
Figure 6. Maximum peak pulse current versus clamping
voltage
0.1
1.0
10.0
100.0
1000.0
1 10 100 1000
I
PP
(A)
S
M
6
T
3
0
A
Y/CA
Y
SM6T82A
Y/CAY
SM6T6V8AY/CA
Y
T = 25 °C
j initial
8/20 µs
10/1000 µs
V (V)
CL
Figure 7. Junction capacitance versus reverse applied
voltage (unidirectional types)
C(pF)
10
100
1000
10000
1 10 100 1000
SM6T6V8AY
SM6T30AY
SM6T82AY
f = 1 MHz
V = 30 mV
T = 25 °C
OSC RMS
j
V (V)
R
SM6TY
Characteristics (curves)
DS6905 - Rev 10
page 4/15