
User Guide


76
Chapter 7
The Logit Loglinear Analysis procedure displays model information and goodness-of-
fit statistics. In addition, you can choose one or more of the following options:
Display. Several statistics are available for display: observed and expected cell
frequencies; raw, adjusted, and deviance residuals; a design matrix of the model; and
parameter estimates for the model.
Plot. Plots available for custom models include two scatterplot matrices (adjusted
residuals or deviance residuals against observed and expected cell counts). You can
also display normal probability and detrended normal plots of adjusted residuals or
deviance residuals.
Confidence Interval. The confidence interval for parameter estimates can be adjusted.
Criteria. The Newton-Raphson method is used to obtain maximum likelihood
parameter estimates. You can enter new values for the maximum number of iterations,
the convergence criterion, and delta (a constant added to all cells for initial
approximations). Delta remains in the cells for saturated models.
To Specify Options
From the menus choose:
Analyze
Loglinear
Logit...
In the Logit Loglinear Analysis dialog box, click Options.
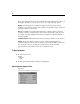
Logit Loglinear Analysis Save
Figure 7-4
Logit Loglinear Analysis Save dialog box