
User Guide


63
Chapter
6
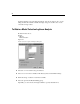
General Loglinear Analysis
The General Loglinear Analysis procedure analyzes the frequency counts of
observations falling into each cross-classification category in a crosstabulation or a
contingency table. Each cross-classification in the table constitutes a cell, and each
categorical variable is called a factor. The dependent variable is the number of cases
(frequency) in a cell of the crosstabulation, and the explanatory variables are factors
and covariates. This procedure estimates maximum likelihood parameters of
hierarchical and nonhierarchical loglinear models using the Newton-Raphson
method. Either a Poisson or a multinomial distribution can be analyzed.
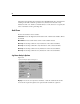
You can select up to 10 factors to define the cells of a table. A cell structure variable
allows you to define structural zeros for incomplete tables, include an offset term in the
model, fit a log-rate model, or implement the method of adjustment of marginal tables.
Contrast variables allow computation of generalized log-odds ratios (GLOR).
SPSS automatically displays model information and goodness-of-fit statistics. You
can also display a variety of statistics and plots or save residuals and predicted values
in the working data file.
Example. Data from a report of automobile accidents in Florida are used to determine
the relationship between wearing a seat belt and whether an injury was fatal or
nonfatal. The odds ratio indicates significant evidence of a relationship.
Statistics. Observed and expected frequencies; raw, adjusted, and deviance residuals;
design matrix; parameter estimates; odds ratio; log-odds ratio; GLOR; Wald statistic;
and confidence intervals. Plots: adjusted residuals, deviance residuals, and normal
probability.
Data. Factors are categorical, and cell covariates are continuous. When a covariate is
in the model, SPSS applies the mean covariate value for cases in a cell to that cell.