
User Guide


30
Chapter 2
Compare main effects. Provides uncorrected pairwise comparisons among
estimated marginal means for any main effect in the model, for both between- and
within-subjects factors. This item is available only if main effects are selected
under the Display Means For list.
Confidence interval adjustment. Select least significant difference (LSD),
Bonferroni, or Sidak adjustment to the confidence intervals and significance. This
item is available only if
Compare main effects is selected.
Display. Select Descriptive statistics to produce observed means, standard deviations,
and counts for all of the dependent variables in all cells.
Estimates of effect size gives a
partial eta-squared value for each effect and each parameter estimate. The eta-squared
statistic describes the proportion of total variability attributable to a factor. Select
Observed power to obtain the power of the test when the alternative hypothesis is set
based on the observed value. Select
Parameter estimates to produce the parameter
estimates, standard errors, t tests, confidence intervals, and the observed power for
each test. You can display the hypothesis and error
SSCP matrices and the Residual
SSCP matrix
plus Bartlett’s test of sphericity of the residual covariance matrix.
Homogeneity tests produces the Levene test of the homogeneity of variance for each
dependent variable across all level combinations of the between-subjects factors, for
between-subjects factors only. Also, homogeneity tests include Box’s M test of the
homogeneity of the covariance matrices of the dependent variables across all level
combinations of the between-subjects factors. The spread-versus-level and residual
plots options are useful for checking assumptions about the data. This item is disabled
if there are no factors. Select
Residual plots to produce an observed-by-predicted-by-
standardized residuals plot for each dependent variable. These plots are useful for
investigating the assumption of equal variance. Select
Lack of fit test to check if the
relationship between the dependent variable and the independent variables can be
adequately described by the model.
General estimable function allows you to construct
custom hypothesis tests based on the general estimable function. Rows in any contrast
coefficient matrix are linear combinations of the general estimable function.
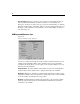
Significance level. You might want to adjust the significance level used in post hoc tests
and the confidence level used for constructing confidence intervals. The specified
value is also used to calculate the observed power for the test. When you specify a
significance level, the associated level of the confidence intervals is displayed in the
dialog box.