
User Guide


25
GLM Repeated Measures
GLM Repeated Measures Profile Plots
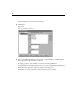
Figure 2-6
Repeated Measures Profile Plots dialog box
Profile plots (interaction plots) are useful for comparing marginal means in your
model. A profile plot is a line plot in which each point indicates the estimated marginal
mean of a dependent variable (adjusted for any covariates) at one level of a factor. The
levels of a second factor can be used to make separate lines. Each level in a third factor
can be used to create a separate plot. Both between-subjects factors and within-subjects
factors can be used in profile plots.
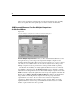
A profile plot of one factor shows whether the estimated marginal means are
increasing or decreasing across levels. For two or more factors, parallel lines indicate
that there is no interaction between factors, which means that you can investigate the
levels of only one factor. Nonparallel lines indicate an interaction.
Figure 2-7
Nonparallel plot (left) and parallel plot (right)