
User Guide


24
Chapter 2
Hypothesis testing is based on the null hypothesis LBM=0, where L is the contrast
coefficients matrix, B is the parameter vector, and M is the average matrix that
corresponds to the average transformation for the dependent variable. You can display
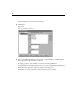
this transformation matrix by selecting
Transformation matrix in the Repeated Measures
Options dialog box. For example, if there are four dependent variables, a within-
subjects factor of four levels, and polynomial contrasts (the default) are used for
within-subjects factors, the M matrix will be (0.5 0.5 0.5 0.5)’. When a contrast is
specified, SPSS creates an L matrix such that the columns corresponding to the
between-subjects factor match the contrast. The remaining columns are adjusted so
that the L matrix is estimable.
Available contrasts are deviation, simple, difference, Helmert, repeated, and
polynomial. For deviation contrasts and simple contrasts, you can choose whether the
reference category is the last or first category.
Contrast Types
Deviation. Compares the mean of each level (except a reference category) to the mean
of all of the levels (grand mean). The levels of the factor can be in any order.
Simple. Compares the mean of each level to the mean of a specified level. This type of
contrast is useful when there is a control group. You can choose the first or last category
as the reference.
Difference. Compares the mean of each level (except the first) to the mean of previous
levels. (Sometimes called reverse Helmert contrasts.)
Helmert. Compares the mean of each level of the factor (except the last) to the mean of
subsequent levels.
Repeated. Compares the mean of each level (except the last) to the mean of the
subsequent level.
Polynomial. Compares the linear effect, quadratic effect, cubic effect, and so on. The
first degree of freedom contains the linear effect across all categories; the second
degree of freedom, the quadratic effect; and so on. These contrasts are often used to
estimate polynomial trends.