
User Guide


103
Cox Regression Analysis
Plots can help you to evaluate your estimated model and interpret the results. You can
plot the survival, hazard, log-minus-log, and one-minus-survival functions.
Because these functions depend on values of the covariates, you must use constant
values for the covariates to plot the functions versus time. The default is to use the
mean of each covariate as a constant value, but you can enter your own values for the
plot using the Change Value control group.
You can plot a separate line for each value of a categorical covariate by moving that
covariate into the Separate Lines For text box. This option is available only for
categorical covariates, which are denoted by
(Cat) after their names in the Covariate
Values Plotted At list.
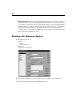
Cox Regression Save New Variables
Figure 11-4
Cox Regression Save New Variables dialog box
You can save various results of your analysis as new variables. These variables can then
be used in subsequent analyses to test hypotheses or to check assumptions.
Survival. Allows you to save the survival function, standard error, and log-minus-log
estimates as new variables.
Diagnostics. Allows you to save the hazard function, partial residuals, and DfBeta(s)
for the regression as new variables.
If you are running Cox with a time-dependent covariate, DfBeta(s) are the only
variables that you can save. You can also save the linear predictor variable X*Beta.