
User Guide


97
Kaplan-Meier Survival Analysis
Kaplan-Meier Options
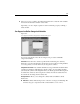
Figure 10-5
Kaplan-Meier Options dialog box
You can request various output types from Kaplan-Meier analysis.
Statistics. You can select statistics displayed for the survival functions computed,
including survival table(s), mean and median survival, and quartiles. If you have
included factor variables, separate statistics are generated for each group.
Plots. Plots allow you to examine the survival, hazard, log-survival, and one-minus-
survival functions visually. If you have included factor variables, functions are plotted
for each group.
KM Command Additional Features
The SPSS command language also allows you to:
Obtain frequency tables that consider cases lost to follow-up as a separate category
from censored cases.
Specify unequal spacing for the test for linear trend.
Obtain percentiles other than quartiles for the survival time variable.
See the SPSS Syntax Reference Guide for complete syntax information.