
User Guide


91
Life Tables
Life Tables Options
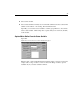
Figure 9-4
Life Tables Options dialog box
You can control various aspects of your Life Tables analysis.
Life tables. To suppress the display of life tables in the output, deselect Life tables.
Plot. Allows you to request plots of the survival functions. If you have defined factor
variable(s), plots are generated for each subgroup defined by the factor variable(s).
Available plots are survival, log survival, hazard, density, and one minus survival.
Compare Levels of First Factor. If you have a first-order control variable, you can select
one of the alternatives in this group to perform the Wilcoxon (Gehan) test, which
compares the survival of subgroups. Tests are performed on the first-order factor. If
you have defined a second-order factor, tests are performed for each level of the
second-order variable.
SURVIVAL Command Additional Features
The SPSS command language also allows you to:
Specify more than one dependent variable.
Specify unequally spaced intervals.
Specify more than one status variable.
Specify comparisons that do not include all the factor and all the control variables.
Calculate approximate, rather than exact, comparisons.
See the SPSS Syntax Reference Guide for complete syntax information.