
User's Manual Part 2


Nomad User’s Manual Appendix D – PESQ Tools GUI Case Study
Copyright © Spirent Communications, Inc. 2013 152
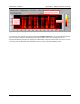
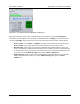
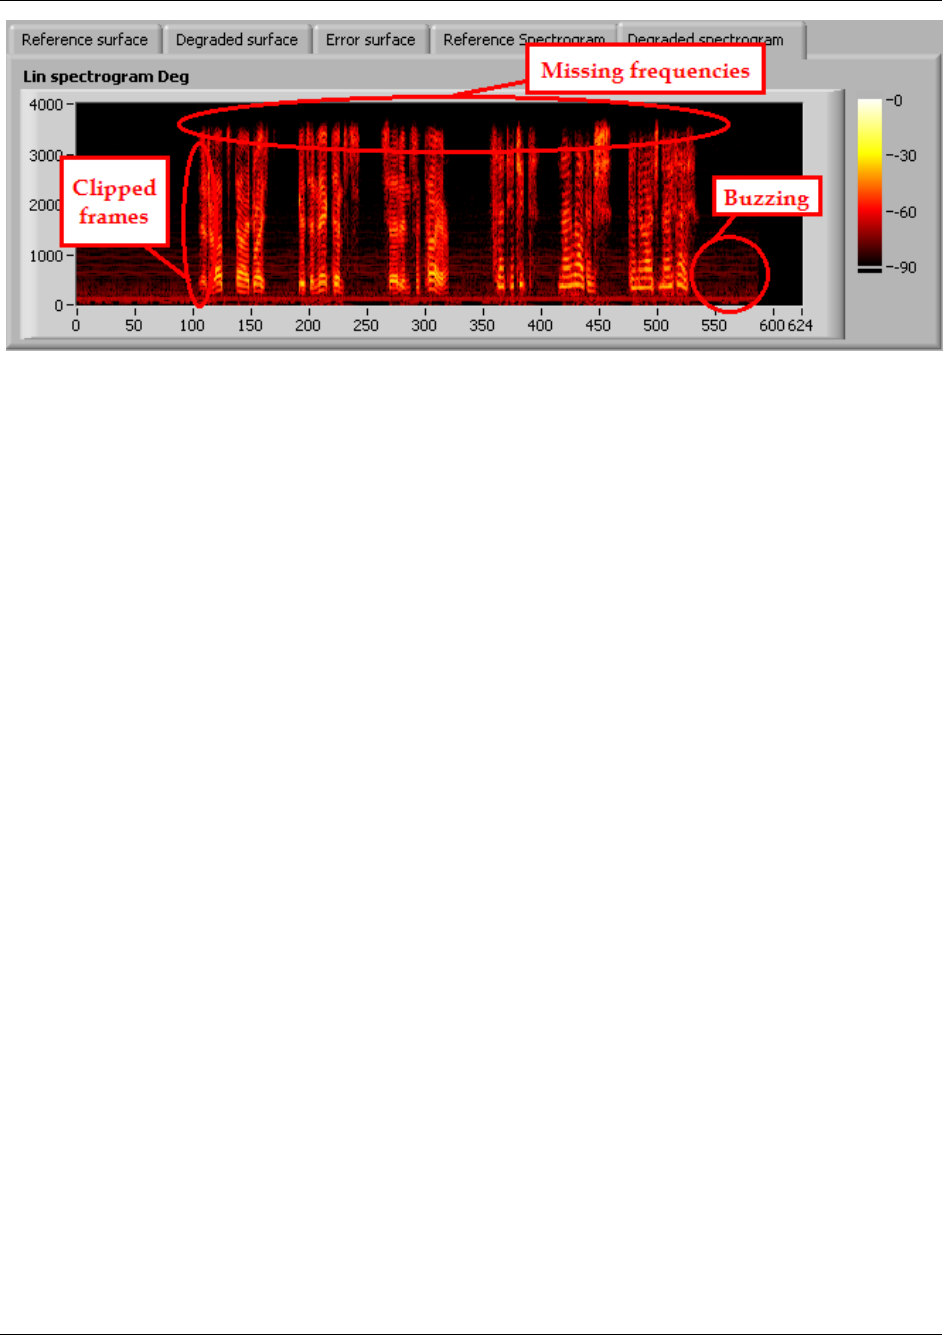
Figure D-8 - Degraded Spectrogram
In conclusion, this example has illustrated how the PESQ Tools GUI may be used to identify specific
areas of a speech sample contributing to poor MOS results. In this case, multiple factors of
background buzzing and speech clipping were identified. Using this information, the source of each
issue may now be identified and rectified in order to achieve the desired MOS results.