
User's Manual Part 2


Nomad User’s Manual Chapter 8 – Analyzing the Results
Copyright © Spirent Communications, Inc. 2013 97
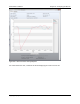
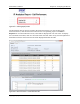
These charts include RTP Throughput, RTP Jitter, and RTP Relative Delay over time, as well as
charts of the distribution of RTP Relative Delay and Distribution of RTP Jitter.
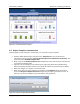
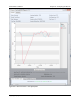
For Voice Quality tasks, a graph will be displayed displaying the MOS scores for the task. Beneath
the graph will be displayed the above mentioned charts for the duration of the task for all
associated streams (Uplink and Downlink). Clicking on any MOS score in the top graph will filter
the remaining charts to the data corresponding the cycle. You may restore the charts to represent
the entire task by clicking the Restore Channel View button.