
User's Manual Part 2

Nomad User’s Manual Chapter 8 – Analyzing the Results
Copyright © Spirent Communications, Inc. 2013 95
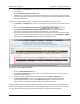
On the Data → Complete tab, select one or more files with which you wish to associate data
in a pcap file.
Click the Import IP Analytics File button.
Navigate to a pcap file that was collected on the device or server side during the session(s)
selected. The data from the pcap file will be analyzed and correlated with the time period of
the selected session(s).
To generate a report displaying the IP Analytics data correlated with Nomad results:
On the Data → Complete tab, select one or more files that you wish to generate the report
on.
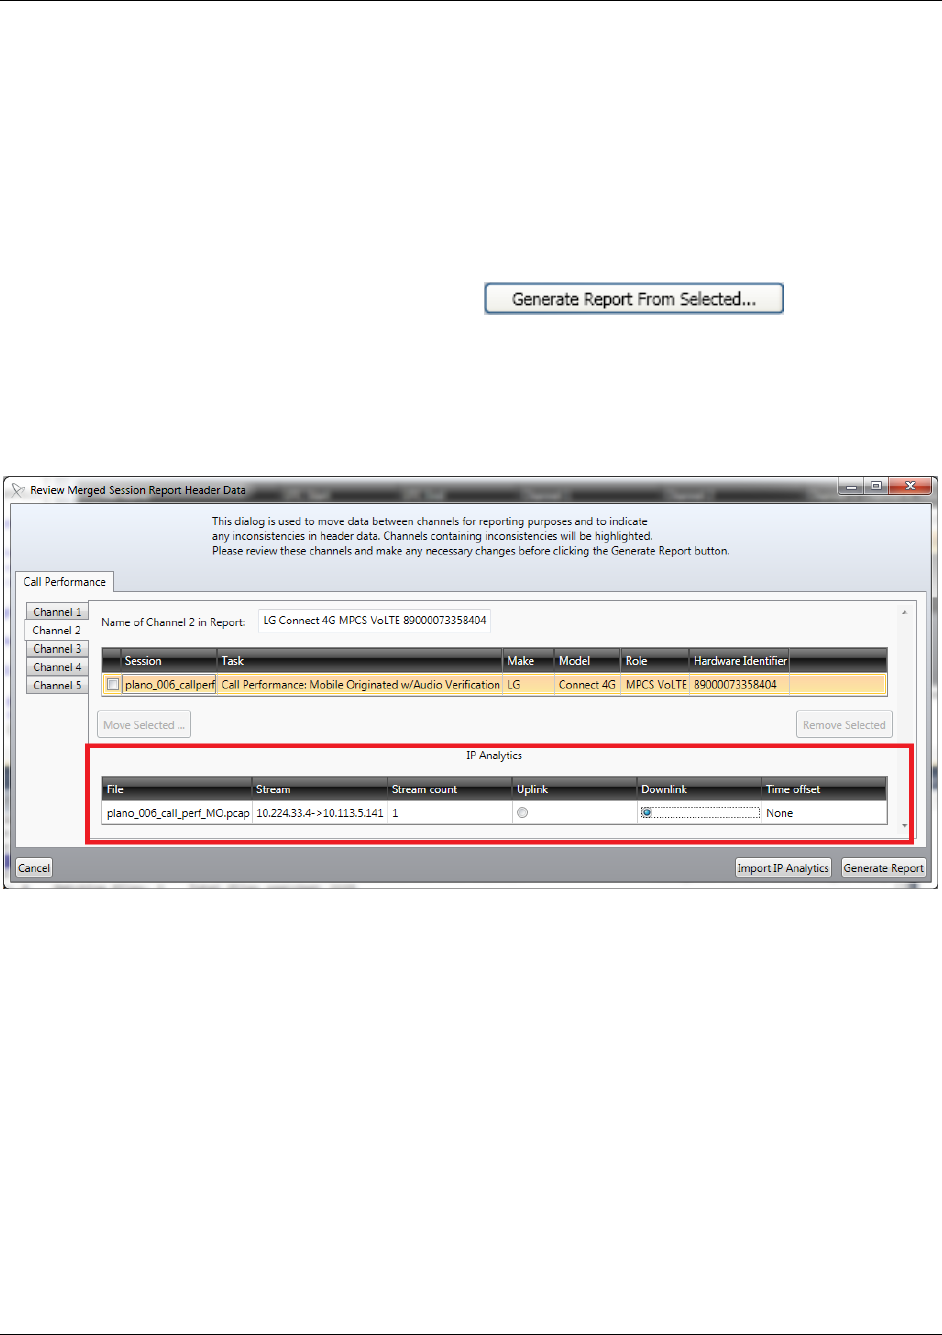
Click the Generate Report From Selected button.
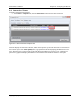
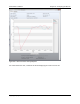
The Review Merged Session Report Header Data window will appear (for more
information on the general functionality of this window, see section 8.1)
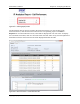
The streams of imported IP data will be listed in the IP Analytics table at the bottom of the
window. For each channel applicable (the tabs on the left), select the Downlink or Uplink
radio button in the IP Analytics table for the corresponding streams.
Figure 8-26 – Associating IP Analytics data
Press the Generate Report button.
On the Save As window, provide a location and name for the report to be generated, and
then click the Save button.
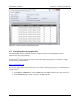
A report with the provided name will be displayed on the Data → Reports tab.
Click the View IP link to view an excel report containing the IP Analytics data and
associated Nomad results. Click on the Interactive button to view an interactive
representation of the IP Analytics data and associated Nomad results.
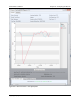
The generated Excel file will display graphs of Nomad results, and graphs of corresponding Jitter,
Delay, and Throughput statistics for the corresponding time period. At the top of the excel report,
you can select the starting cycle, and amount of cycles to be represented in the graphs.