
User's Manual Part 2

Nomad User’s Manual Chapter 8 – Analyzing the Results
Copyright © Spirent Communications, Inc. 2013 90
8.4 Interactive Viewer
To display the Interactive Viewer:
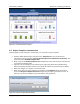
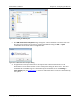
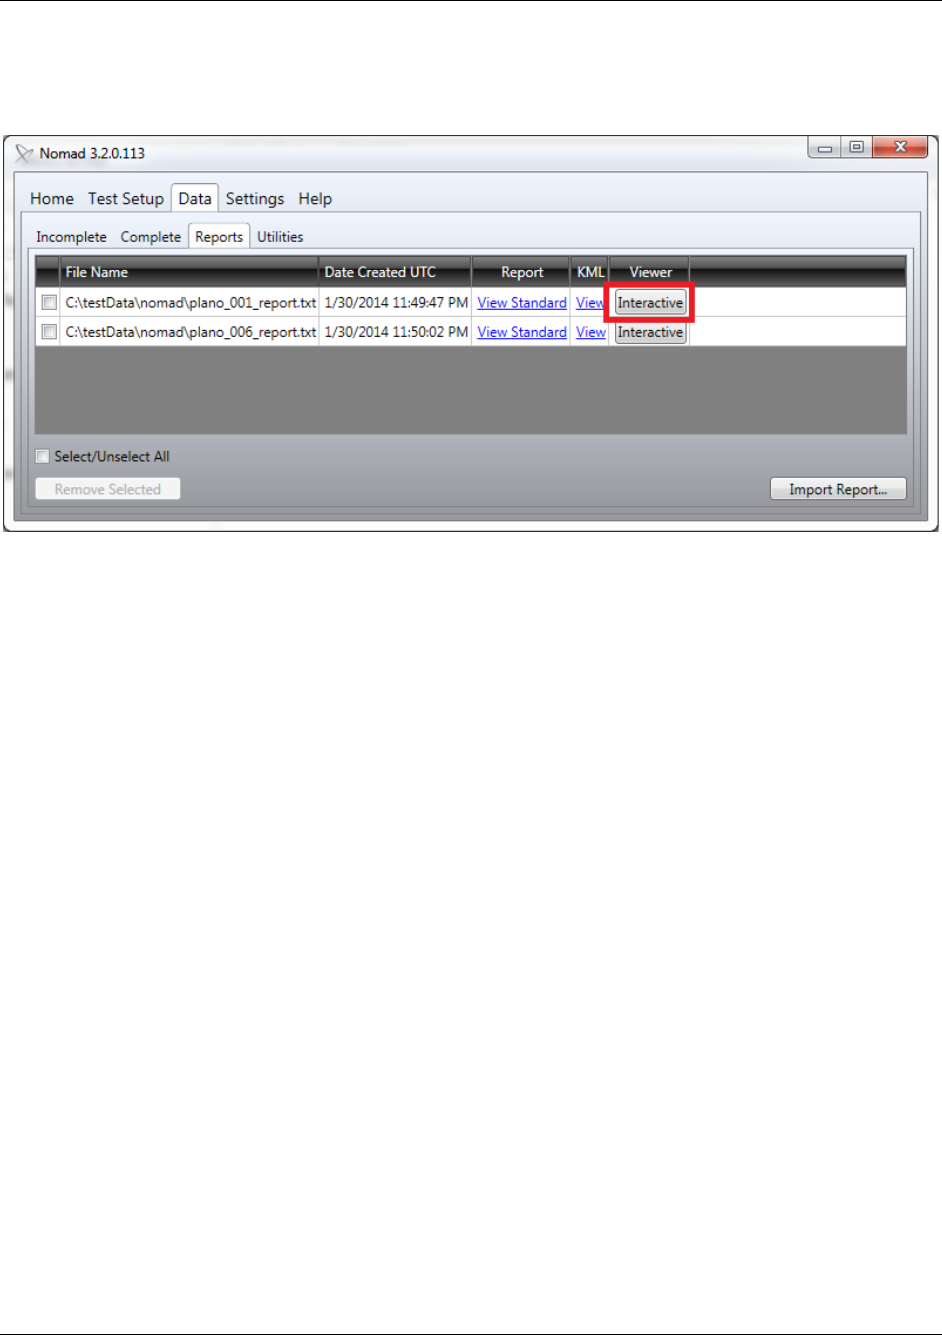
On the Data → Reports tab, click the Interactive button for the data of interest.
Figure 8-19 – Interactive button on Reports tab
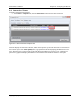
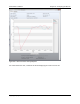
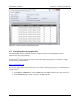
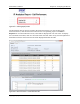
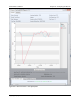
This will display the Interactive Viewer, which will represent cycle level data from each channel in
the session report. For Voice Quality data, a graph will be shown displaying the MOS scores over
time. Hovering over a point on the graph will display the MOS score for that cycle. Clicking on a
point in the graph will display information at the bottom of the window relative to that cycle.