
User Manual

28
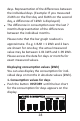
Please note that the bar graph readout is
approximate. If e.g. 1 BAR = 1 kWh and 2 bars
are shown for one day, the actual measured
value may be between 1.01 kWh and 1.99 kWh.
Please access the data for days or months for
exact measured values.
Displaying consumpon values (kWh)
You can also display the consumpon for indi-
vidual days or months in absolute values (kWh).
1. Consumpon values for days
days. Representaon of the differences between
the individual days. (Example: If you measured
2 kWh on the first day and 3kWh on the second
day, a difference of 1kWh is displayed.)
The difference in consumpon over the last 7
months.Representaon of the differences
between the individual months.
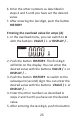
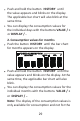
Push the buon HISTORY unl the bar chart
for the consumpon for days appears on the
display.