
User Manual

27
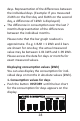
graph and numerical figure.This is possible for
the last 7 days or for the last seven 7 months.
The individual bars in the columns represent
the kWh consumed. The scale is always shown
on the display, such as (1 Bar = 1 kWh) or 1 Bar
= 2 kWh) etc.; the scale changes depending on
consumpon.
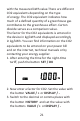
Graphical representaon of consumpon
The consumpon is shown as a graphic with
bars on the boom of the LCD display, whereu-
pon each bar represents the consumpon for
one day and/or a month (-1 = one day/month
ago, -2 = two days/months ago and/or up to -7
= seven days/months ago). This allows you to
quickly access your power consumpon over
the past days or months graphically as a bar or
as consumpon values.
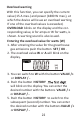
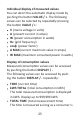
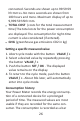
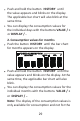
The following values are shown one aer
another by repeatedly pushing the buon
HISTORY :
The consumpon for the last 7 days
The consumpon for the last 7 months
The difference in consumpon over the last 7