
User's Manual
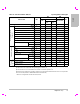


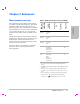
Table Of Contents
- M-Turbo Ultrasound System User Guide
- Contents
- Introduction
- Chapter 1: Getting Started
- Chapter 2: System Setup
- Displaying the setup pages
- Restoring default settings
- A & B Key, Footswitch setup
- Administration setup
- Annotations setup
- Audio, Battery setup
- Cardiac Calculations setup
- Connectivity setup
- Date and Time setup
- Display Information setup
- IMT Calculations setup
- Network Status setup
- OB Calculations setup
- OB Custom Measurements setup
- OB Custom Tables setup
- Presets setup
- System Information setup
- USB Devices setup
- Chapter 3: Imaging
- Chapter 4: Measurements and Calculations
- Chapter 5: Troubleshooting and Maintenance
- Chapter 6: Safety
- Ergonomic safety
- Electrical safety classification
- Electrical safety
- Equipment safety
- Battery safety
- Clinical safety
- Hazardous materials
- Electromagnetic compatibility
- ALARA principle
- Acoustic artifacts
- Guidelines for reducing MI and TI
- Output display
- Transducer surface temperature rise
- Acoustic output measurement
- Acoustic output tables
- Labeling symbols
- Chapter 7: References
- Chapter 8: Specifications
- Glossary
- Index

140 Sources of measurement errors
Sources of measurement
errors
Ingeneral,twotypesoferrorscanbeintroduced
intothemeasurement:
Acquisition Error Includeserrorsintroducedby
theultrasoundsystemelectronicsrelatingto
signalacquisition,signalconversion,andsignal
processingfordisplay.Additionally,
computationalanddisplayerrorsareintroduced
bythegenerationofthepixelscalefactor,
applicationofthatfactorto
thecaliperpositions
onthescreen,andthemeasurementdisplay.
Algorithmic Error Theerrorintroducedby
measurements,whichareinputtohigherorder
calculations.Thiserrorisassociatedwith
Table 2: M Mode Measurement and
Calculation Accuracy and Range
M Mode Measurement
Accuracy and Range
System Tolerance
Accuracy By
Test Method
Range
Distance < +/-
2%
plus
1% of
full
scale
a
Acquisition
Phantom
b
0-26 cm
Time < +/-
2%
plus
1% of
full
scale
c
Acquisition
Phantom
d
0.01-10
sec
Heart Rate < +/-
2%
plus
(Full
Scale
c
*
Heart
Rate/1
00) %
Acquisition
Phantom
d
5-923
bpm
a. Full scale for distance implies the maximum depth of the
image.
b. An RMI 413a model phantom with 0.7 dB/cm MHz
attenuation was used.
c. Full scale for time implies the total time displayed on the
scrolling graphic image.
d. SonoSite special test equipment was used.
Table 3: PW Doppler Mode Measurement and
Calculation Accuracy and Range
Doppler Mode
Measurement
Accuracy and Range
System
Tolerance
Accuracy By
Test
Method
a
Range
Velocity
cursor
< +/- 2%
plus 1% of
full scale
b
Acquisition Phantom 0.01
cm/sec-
550 cm/s
ec
Frequency
cursor
< +/- 2%
plus 1% of
full scale
b
Acquisition Phantom 0.01kHz-
20.8 kHz
Time < +/- 2%
plus 1% of
full scale
c
Acquisition Phantom 0.01-10
sec
a. SonoSite special test equipment was used.
b. Full scale for frequency or velocity implies the total frequency
or velocity magnitude, displayed on the scrolling graphic
image.
c. Full scale for time implies the total time displayed on the
scrolling graphic image.