
Data Sheet

2005-2013 Microchip Technology Inc. DS20001984F-page 7
MCP73831/2
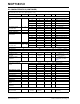
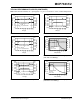
2.0 TYPICAL PERFORMANCE CURVES
Note: Unless otherwise indicated, V
DD
= [V
REG
(typical) + 1V], I
OUT
= 10 mA and T
A
= +25°C, Constant-Voltage mode.
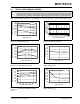
FIGURE 2-1: Battery Regulation Voltage
(V
BAT
) vs. Supply Voltage (V
DD
).
FIGURE 2-2: Battery Regulation Voltage
(V
BAT
) vs. Ambient Temperature (T
A
).
FIGURE 2-3: Output Leakage Current
(I
DISCHARGE
) vs. Battery Regulation Voltage
(V
BAT
).
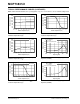
FIGURE 2-4: Charge Current (I
OUT
) vs.
Programming Resistor (R
PROG
).
FIGURE 2-5: Charge Current (I
OUT
) vs.
Supply Voltage (V
DD
).
FIGURE 2-6: Charge Current (I
OUT
) vs.
Supply Voltage (V
DD
).
Note: The graphs and tables provided following this note are a statistical summary based on a limited number of
samples and are provided for informational purposes only. The performance characteristics listed herein
are not tested or guaranteed. In some graphs or tables, the data presented may be outside the specified
operating range (e.g., outside specified power supply range) and therefore outside the warranted range.
4.170
4.175
4.180
4.185
4.190
4.195
4.200
4.205
4.210
4.50 4.75 5.00 5.25 5.50 5.75 6.00
Supply Voltage (V)
Battery Regulation Voltage
(V)
MCP73831-2
I
OUT
= 10 mA
I
OUT
= 100 mA
I
OUT
= 450 mA
4.170
4.175
4.180
4.185
4.190
4.195
4.200
4.205
4.210
-40
-30
-20
-10
0
10
20
30
40
50
60
70
80
Ambient Temperature (°C)
Battery Regulation Voltage (V)
MCP73831-2
I
OUT
= 10 mA
I
OUT
= 100 mA
I
OUT
= 450 mA
0.00
0.05
0.10
0.15
0.20
0.25
0.30
0.35
0.40
3.00 3.20 3.40 3.60 3.80 4.00 4.20
Battery Regulation Voltage (V)
Output Leakage Current (µA)
+85°C
-40°C
+25°C
0
50
100
150
200
250
300
350
400
450
500
2 7 12 17 22 27 32 37 42 47 52 57 62 67
Programming Resistor (kΩ)
Charge Current (mA)
96
97
98
99
100
101
102
103
104
4.50 4.75 5.00 5.25 5.50 5.75 6.00
Supply Voltage (V)
Charge Current (mA)
R
PROG
= 10 kΩ
500
502
504
506
508
510
512
514
516
4.50 4.75 5.00 5.25 5.50 5.75 6.00
Supply Voltage (V)
Charge Current (mA)
R
PROG
= 2 kΩ