
User Manual
Page 19
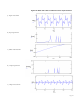
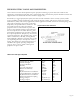
Key to following figures
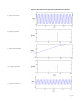
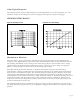
Figure 18
shows a relatively high-frequency sine wave passing through the network. In the
input spectrum, the signal is represented by a single spectral line at the appropriate
frequency. This frequency is just below the filter "cut-off", and so is only slightly
attenuated by the network. The resulting output wave is diminished in amplitude, and
slightly shifted in phase.
Figure 19 shows the same process applied to a slower sine wave. In this case, the attenuation is
much greater, and the phase shift more significant. This situation occurs when trying
to monitor steady vibration at "too low" a frequency using a piezo sensor. The phase
behavior may be significant if a control loop is to be implemented.
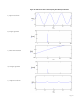
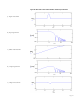
Figure 20 shows a harmonic series, with a number of discrete spectral lines all lying below the
cut-off frequency. Each is attenuated to a different extent, and so the "balance" of
harmonics in the output signal is altered.
Figure 21 shows a slow half-sine input pulse (typical of many mechanical impact signals).
Although the high-frequency content is largely unaltered, the output waveform
appears heavily "distorted" and clearly shows both positive and negative excursions,
whereas the input waveform is unipolar.
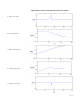
Figure 22 shows a sawtooth waveform with slowly rising "leading edge" followed by a "snap"
descent back to zero. Many piezo switches detect this form of mechanical event. In
the output waveform, the "leading edge" has almost disappeared, but the "snap" gives
almost full amplitude. Note the polarity of the output pulse relative to the input
waveform.