
Datasheet
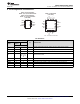
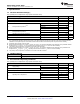
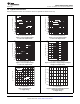

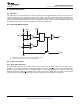
Table Of Contents
- 1 Features
- 2 Applications
- 3 Description
- 4 Simplified Schematic
- Table of Contents
- 5 Revision History
- 6 Pin Configuration and Functions
- 7 Specifications
- 8 Detailed Description
- 9 Applications and Implementation
- 10 Power Supply Recommendations
- 11 Device and Documentation Support
- 12 Mechanical, Packaging, and Orderable Information

5
4
2
1
0
9
3
5 6 7 8 9 10 11
− Supply Current − mA
7
6
8
10
12 13 14 15
T
A
= 25°C
T
A
= 125°C
T
A
= −55° C
Output Low,
No Load
CC
I
V
CC
− Supply Voltage − V
1
0.995
0.990
0.985
0 5 10
1.005
1.010
1.015
15 20
CC
V
Pulse Duration Relative to V
alue at = 10 V
V
CC
− Supply Voltage − V
8
T
A
= 125°C
T
A
= 25°C
T
A
= −55°C
V
CC
= 15 V
− Low-Level Output V
oltage − V
V
OL
I
OL
− Low-Level Output Current − mA
0.1
0.04
0.01
1 2 4 7 10 20 40 70 100
0.07
1
0.4
0.7
10
4
7
0.02
0.2
2
1
0.6
0.2
0
1.4
1.8
2.0
0.4
1.6
0.8
1.2
−
I
OH
− High-Level Output Current − mA
T
A
= 125°C
T
A
= 25°C
100704020107421
V
CC
= 5 V to 15 V
T
A
= −55°C
V
CC
V
OH
− Voltage Drop − V
)
(
T
A
= 125°C
T
A
= 25°C
I
OL
− Low-Level Output Current − mA
V
CC
= 5 V
T
A
= −55°C
0.1
0.04
0.01
1 2 4 7 10 20 40 70 100
0.07
1
0.4
0.7
10
4
7
0.02
0.2
2
− Low-Level Output V
oltage − V
V
OL
V
CC
= 10 V
− Low-Level Output V
oltage − V
V
OL
I
OL
− Low-Level Output Current − mA
0.1
0.04
0.01
1 2 4 7 10 20 40 70 100
0.07
1
0.4
0.7
10
4
7
0.02
0.2
2
T
A
= 125°C
T
A
= 25°C
T
A
= −55°C
NA555
,
NE555
,
SA555
,
SE555
www.ti.com
SLFS022I –SEPTEMBER 1973–REVISED SEPTEMBER 2014
7.6 Typical Characteristics
Data for temperatures below –40°C and above 105°C are applicable for SE555 circuits only.
Figure 1. Low-Level Output Voltage Figure 2. Low-Level Output Voltage
vs Low-Level Output Current vs Low-Level Output Current
Figure 3. Low-Level Output Voltage Figure 4. Drop Between Supply Voltage and Output
vs Low-Level Output Current vs High-Level Output Current
Figure 5. Supply Current Figure 6. Normalized Output Pulse Duration
vs Supply Voltage (Monostable Operation)
vs Supply Voltage
Copyright © 1973–2014, Texas Instruments Incorporated Submit Documentation Feedback 7
Product Folder Links: NA555 NE555 SA555 SE555