
User's Manual


US-ENGLISH – 19
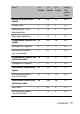
♦ Results
IMPROVEMENT IN COMPOSITE ENDPOINT
Patients were included in the analysis if complete (peak VO
2
and
quality of life) baseline and six-month data were available.
Number of
patients
contributing to
analysis
Mean percent
improvement in
composite
endpoint for
control group
Mean percent
improvement in
composite
endpoint for
CRT-D group
Percent
greater
improvement
for CRT-D
group
p-value
132
15.5 %
24.9 %
9.4 %
0.046
SIX-MONTH SYSTEM COMPLICATION-FREE RATE
Number of patients
contributing to
analysis
Kaplan-Meier six-
month
complication-free
estimate
One-sided lower 95% confidence
bound for six-month complication-
free estimate
190
89.5 %
84.1 %
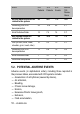
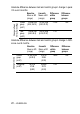
♦ Absolute Differences in Peak VO2 and QOL
The tables below show the absolute differences between the control
and test groups’ peak VO
2
and QOL over the 6 month follow-up
period in the clinical trial.