
User's Manual

US-ENGLISH – 23
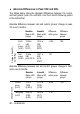
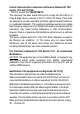
The table below presents the percentage of patients in each group who
improved, worsened, or remained unchanged in each element of the
composite score and the composite score itself.
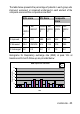
Histograms for Respiratory exchange rate (RER) at peak VO
2
at
baseline and 6 month follow-up are provided below:
RER at peak VO
2
at baseline
0
10
20
30
40
50
60
≤ 0.79 0.80-0.89 0.90-0.99 1.0-1.09 1.10-1.19 1.20-1.29 ≥ 1.30
RER
Percent of patients
Test
Control
QOL score
VO
2
Score
Composite
Score
Contro
l
GROU
P
Test
GROUP
Control
GROU
P
Test
GROU
P
Control
GROU
P
Test
GROU
P
% Improved
75.6
74.7
48.8
67.0
62.2
70.9
% Worsened
24.4
25/03/09
51.2
31.9
37.8
28.6
% Unchanged
0.0
0.0
0.0
1.1
0.0
0.0