
User's Manual

22 – US-ENGLISH
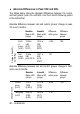
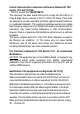
Absolute Differences in Peak VO2 and QOL
The tables below show the absolute differences between the control
and test groups’ peak VO
2
and QOL over the 6 month follow-up period
in the clinical trial.
Absolute difference between test and control groups’ change in peak
V0
2
over 6 months
Baseline
Mean ± SD
(range)
6-month
Mean ± SD
(range)
Difference
within group
Difference
between
groups
Change in Peak VO
2
(
mL/min/Kg)
Contr
ol
group
(n=41)
13.39 ±
4.58
(5.02,
24.10)
13.12 ±
3.99
(3.30,
20.70)
- 0.28
1.85
Test
group
(n=91)
11.84 ±
3.90
(3.50, 26.3)
13.41 ±
4.28
(6.18,
27.67)
1.57
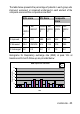
Absolute difference between test and control groups’ change in QOL
score over 6 months
Baseline
Mean ± SD
(range)
6-month
Mean ± SD
(range)
Difference
within group
Difference
between
groups
Change in QOL
Control
group
(n=41)
47.5 ±
19.29
(9, 90.3)
31.21 ±
23.96
(0, 95)
16.29
1.28
Test group
(n=91)
52.81 ±
21.84
(9, 92)
35.24 ±
23.73
(0, 93)
17.57