
Manual
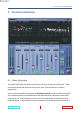
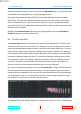
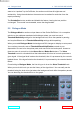
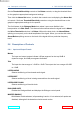
Table Of Contents
- Introduction
- The Oxford DeClicker
- The Oxford DeBuzzer
- The Oxford DeNoiser
- Preset Manager Toolbar
- Supported Platforms
- System Requirements
- Copyright and Acknowledgements

2.2 OutputPanel 2 THE OXFORD DECLICKER
threshold. One potential problem with this method is that it is possible that only the
middle of the event is actually repaired because the width of the event is perceived to be
narrower than it actually is (because the Threshold is at the peak of the triangle where it is
narrowest.) In practice, however, any partial repairs can be fully repaired later on by the
DeCrackle section which does tend to clean up the repairs done in the DePop and
DeClick sections.
The DePop section can detect events from 10ms down to 1ms. However, it is best to
adjust the DePop Threshold and Sensitivity to ensure that the fewest repairs are done in
this section. Use a low DePop Threshold and a minimum of Sensitivity to achieve
this.
If possible, use the DeClicker section to capture the longest and widest of the clicks.
Again use a low DeClick Threshold and a minimum of Sensitivity to achieve this.
2.2 OutputPanel
The listen section of the Output Panel contains an option to listen to the difference
between the input and the processed output. This is labeled “Diff”. This is particularly
useful in this plug-in for hearing what has been repaired, and for listening to the quality of
the repairs without being distracted by the audio material. You can also listen for
breakthrough of audio on the pops, meaning that the repair is too wide (you need to raise
the DePop Threshold a bit). You can listen for a constant scratching sound, which means
that the DeCrackle section may be doing too many repairs, particularly if you can’t hear
that scratching sound in the original. You can listen to make sure that the sound of the
clicks is as close as possible to the sound of the clicks in the original. If they are brighter,
it may mean that the DeClick Threshold slider needs to go lower to capture the true width
of the clicks.
2.3 EventsGraph
The events graph is an important visual display, showing events as they are being
detected. The events are shown with duration along the X-axis and amplitude/energy
along the Y-axis. It is worthwhile playing with the Threshold and Sensitivity controls to
see their effect on the number of events that are detected, and at what level and width
they are displayed on the event graph.
For example, you will notice that as you bring the Threshold lower, not only are more
events detected, but the events tend to move to the left, meaning the events are being
www.sonnox.com 7 Gotocontents