
Manual
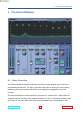
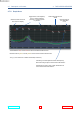
Table Of Contents
- Introduction
- The Oxford DeClicker
- The Oxford DeBuzzer
- The Oxford DeNoiser
- Preset Manager Toolbar
- Supported Platforms
- System Requirements
- Copyright and Acknowledgements

4.7 DescriptionofControls 4 THE OXFORD DENOISER
4.7.2 GraphArea
Select the audio channel to
view in the FFT display
Toggle the law of the frequency
axis. Lin shows greater HF
precision, Log shows greater
LF precision
Select which Bias Curve is
visible
Reset all nodes of
the visible Bias
Curve
Threshold Bias is red, and the red trace shows the biased Threshold Level
The grey trace shows the un-biased Threshold (for reference)
Click+Drag a node to adjust the bias at that frequency.
Shift+Click+Drag to adjust a node and all nodes below it.
Double-Click to reset a node, or Shift+Double-Click to
reset a node and all nodes below it.
Reduction Bias is yellow, and the yellow trace shows the biased Threshold Level
www.sonnox.com 40 Gotocontents