Contents 1 Introduction 4 1.1 Restoration Processing Workflow . . . . . . . . . . . . . . . . . . . . . . . . . 2 The Oxford DeClicker 4 5 2.1 Basic Operation . . . . . . . . . . . . . . . . . . . . . . . . . . . . . . . . . . 5 2.2 Output Panel . . . . . . . . . . . . . . . . . . . . . . . . . . . . . . . . . . . . 7 2.3 Events Graph . . . . . . . . . . . . . . . . . . . . . . . . . . . . . . . . . . . . 7 2.4 The Exclude Box . . . . . . . . . . . . . . . . . . . . . . . . . . . . . . . . . .
.8 Stereo Behaviour . . . . . . . . . . . . . . . . . . . . . . . . . . . . . . . . . . 31 3.9 Specifications . . . . . . . . . . . . . . . . . . . . . . . . . . . . . . . . . . . . 32 3.9.1 Sample Rates . . . . . . . . . . . . . . . . . . . . . . . . . . . . . . . 32 3.9.2 Delays and CPU Usage . . . . . . . . . . . . . . . . . . . . . . . . . . 32 3.9.3 Control Ranges . . . . . . . . . . . . . . . . . . . . . . . . . . . . . . . 33 4 The Oxford DeNoiser 34 4.1 Basic Operation . . . . . . . . .
1 1 INTRODUCTION Introduction The Sonnox Restore suite is a collection of three plug-ins designed to clean the sound of digital audio recordings that are damaged by • pops, clicks, or crackle • hum, buzzes and whines • noise The tools are not just for restoring old material, but also for removing the clicks, pops, buzzes and background noises that can sometimes accidentally occur in new recordings.
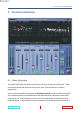
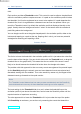
2 2 2.1 THE OXFORD DECLICKER The Oxford DeClicker Basic Operation The Oxford DeClicker has three main sections: DePop, DeClick and DeCrackle. These three sections deal with events that are up to 10ms, 3ms and 0.4ms in duration, respectively. Each of the three sections calculates an Excitation Profile for a given block of samples.
2.1 Basic Operation 2 THE OXFORD DECLICKER click. Each section provides a Threshold control. This control is used to adjust a threshold level within the excitation profile to capture an event. If a peak on the excitation profile is below the threshold, it will not be registered as an event to be repaired. If a peak breaches the threshold line, then it is registered as a detected event and can be repaired.
2.2 Output Panel 2 THE OXFORD DECLICKER threshold. One potential problem with this method is that it is possible that only the middle of the event is actually repaired because the width of the event is perceived to be narrower than it actually is (because the Threshold is at the peak of the triangle where it is narrowest.) In practice, however, any partial repairs can be fully repaired later on by the DeCrackle section which does tend to clean up the repairs done in the DePop and DeClick sections.
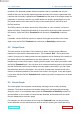
2.4 The Exclude Box 2 THE OXFORD DECLICKER detected as longer duration. Then as you move the Sensitivity down, you will notice that the smallest events disappear first, leaving the largest events. The graph shows green bubbles (DePop), blue bubbles (DeClick) and white bubbles (DeCrackle). The size of the bubbles indicates how loud they are, as does their height above the horizontal axis.
2.5 Dialogue Mode 2 THE OXFORD DECLICKER were to be “repaired” by the DeClicker, the section would lose all brightness and authenticity. Using the exclude box the events can be marked for exclusion from the repair processing. The Exclude Box button enables and disable the feature, leaving the box position unchanged. This control is automatable, as are the drag handles. 2.5 Dialogue Mode The Dialogue Mode is another unique feature of the Oxford DeClicker.
2.6 Description of Controls 2 THE OXFORD DECLICKER Set the Threshold/Sensitivity controls of the Below controls, or drag the threshold lines on the graphs to appropriate background settings. Then click the Above Set button, to switch the controls over to displaying the Above Set of controls. Set these Threshold/Sensitivity controls or drag the threshold lines on the graphs to appropriate settings for the speech.
2.6 Description of Controls 2.6.2 2 THE OXFORD DECLICKER De-Pop, De-Click and De-Crackle Panels THRESHOLD This control is used to adjust a threshold level within the Excitation Profile to capture an event. If a peak on the Excitation Profile is below the threshold, it will not be registered as an event to be repaired. If a peak breaches the threshold line, then it is registered as a detected event and can be repaired.
2.6 Description of Controls 2.6.3 2 THE OXFORD DECLICKER Dialogue Mode VOICE THRESHOLD This control determines the threshold at which detected events are allocated between the two sets of Detect/Repair settings. Any event detected while the level is above the threshold (coloured blue) will be allocated to the Above Set; any event detected while the level is below the threshold (coloured red) will be allocated to the Below Set.
2.6 Description of Controls 2.6.4 2 THE OXFORD DECLICKER Display Controls Advanced Mode When Dialogue Mode is OFF, this shows and hides the Excitation Profiles. When Dialogue Mode is ON, it shows and hides the Excitation Profiles, Level Profile and Spectrum display. L&R Select which channels are shown in the Events Graph. Exclude Box Enable and disable the Exclude Box. Lin/Log Change the x-axis between linear and logarithmic scaling. Decay/Hold Events decay, or persist indefinitely.
2.7 Signal and Control Flow Diagram 2 2.7 Signal and Control Flow Diagram 2.8 Stereo Behaviour THE OXFORD DECLICKER For correct stereo operation, when instantiated on a stereo track the DeClicker has two independent detect and repair circuits. www.sonnox.
2.9 Specifications 2.9 2 THE OXFORD DECLICKER Specifications 2.9.1 Sample Rates The supported samples rates are 44.1, 48, 88.2 and 96kHz only. 2.9.2 Delays and CPU Usage VST, AU and AAX Native 44.1 48 kHz 88.2 kHz 96 kHz Delay 3250 3328 6180 6336 Separately from the latency, the Restore plug-ins address CPU usage in various ways.
2.9 Specifications 2.9.3 2 THE OXFORD DECLICKER Control Ranges Range Nominal Pop duration 2ms to 10 ms Nominal Click duration 0.1 ms to 3 ms Nominal Crackle duration < 0.4 ms Dialogue Mode Voice Threshold 0 dB to -96 dB Dialogue Mode LF Filter 20 kHz to (HF - 15%) Dialogue Mode HF Filter (LF + 15%) to 20 kHz Minimum Side-Channel Frequency Window 15% Input Trim -12 dB to +12 dB Output Trim -12 dB to + 12 dB www.sonnox.
3 3 3.1 THE OXFORD DEBUZZER The Oxford DeBuzzer Basic Operation The Oxford DeBuzzer is divided into two stages: Detection and Removal. Removal of buzz is usually accomplished by using a comb filter. The comb filter has many tight notches in the frequency spectrum that eliminate the fundamental frequency and associated harmonics of a buzz. For this process to work well, the frequency of the fundamental must be very accurately determined.
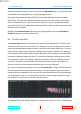
3.2 Tracking Modes 3 THE OXFORD DEBUZZER control. This is a plot of strength of a given nominal frequency in the input signal, and the display extends over a wide range either side of the nominal frequency. With the nominal set to 50Hz, any peak frequency between 45Hz and 55Hz will be displayed. The second tool to help isolate the fundamental is the large FFT display. The FFT displayed by default in this graph is no ordinary FFT of the input signal, but can accumulate FFT data.
3.3 Removal Filters 3 THE OXFORD DEBUZZER click on a peak to set up the plug-in to remove that frequency. Auto Mode is suitable for tracking a weak, slowly wandering fundamental and operates over all three frequency bands. Fast tracking mode allows the removal filters to automatically follow a quickly wandering fundamental. This mode operates on MF and HF frequency selections only (if Fast is selected in the LF range, the mode is forced to Auto and the Auto button flashes).
3.4 Sensitivity Modes for Optimal Buzz Removal 3 THE OXFORD DEBUZZER notches have equal width when viewed on a log frequency scale, but when viewed on a linear scale they will appear to widen as the frequency increases. This means the notches will tend to merge together at higher frequencies, so this is not recommended for removal of wide-band buzzes as it is likely to cause unnecessary damage to the original audio.
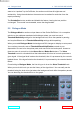
3.4 Sensitivity Modes for Optimal Buzz Removal 3 THE OXFORD DEBUZZER you reduce the sensitivity you are moving signal and buzz elements out of the Diff output into the Audio output. This diagram shows a fairly broadband buzz, with elements up to 10kHz or more: The following sequence of figures shows the Audio output with the DeBuzzer in circuit but with steadily decreasing sensitivity.
3.4 Sensitivity Modes for Optimal Buzz Removal 3 THE OXFORD DEBUZZER Lowering the sensitivity further means the first harmonic appears in the Audio output: Lowering further allows more and more harmonics into the Audio output: When the Sensitivity control is very low the whole buzz will be in the audio output, and the DeBuzzer is removing no buzz: Clearly here the Sensitivity is far too low. The optimal setting is just before the fundamental appears in the Audio output. www.sonnox.
3.4 Sensitivity Modes for Optimal Buzz Removal 3.4.2 3 THE OXFORD DEBUZZER The Alternative Mode of Buzz Removal There is a second mode of Buzz removal that might be more appropriate under some circumstances. The sequence above is using the default mode of repair. If Alt Mode is selected, the characteristics of the sequence reverse, with the harmonics appearing in the audio output first, and finally the fundamental.
3.4 Sensitivity Modes for Optimal Buzz Removal 3 THE OXFORD DEBUZZER More harmonics appear: Finally the whole buzz spectrum including the fundamental is in the audio output: The final settings will be a trade-off between removal of buzz elements and quality of repaired signal. This will depend on the characteristics of both the signal and the buzz. As both the signal and the buzz can be almost infinitely variable, there will be cases when each sensitivity mode will be appropriate.
3.5 3.5 The Frequency Detection Window and CPU Usage 3 THE OXFORD DEBUZZER The Frequency Detection Window and CPU Usage Above the Frequency knob is the Peak Profile display, which shows the strength of frequency content within a narrow window around the nominal detector frequency. The width of this window in Hz is determined by the number of comb filters used in the detector algorithm. The CPU load of the host computer is also dependent on the number of filters used.
3.6 Description of Controls 3.6 3.6.1 3 THE OXFORD DEBUZZER Description of Controls Graph Area Switch between the following display modes - Instant FFT - Averaged FFT - Smart FFT – permanent accumulation - Smart FFT – with time constant - Minimum FFT Click and drag to adjust the Range and Slope controls Alt+Click and drag the background to zoom. Click and drag to move the viewport. Click and drag to adjust the fundamental De-Buzz frequency. This control turns green when locked. www.sonnox.
3.6 Description of Controls 3.6.2 3 THE OXFORD DEBUZZER Frequency Detect Panel Peak Profile This shows the strength of a given nominal frequency in the input signal. AUTO The removal filters automatically follow the peak frequency found in the Peak Profile. It is suitable for tracking a weak, slowly wandering fundamental and operates over all three frequency bands. FAST This allows the removal filters to automatically follow a quickly wandering fundamental.
3.6 Description of Controls 3 THE OXFORD DEBUZZER Hz The large frequency control in the centre is used to set the nominal frequency about which in Auto Mode the detection algorithms hunt for a peak in the peak profile. In Freeze mode it determines the frequency of the removal filters. The frequency can be selected using the scribble tab in units of 1Hz (normal), 0.01Hz (Fine adjust) and 0.0001Hz (extreme fine adjust).
3.6 Description of Controls 3.6.3 3 THE OXFORD DEBUZZER Removal Panel COMB Sets the removal filters to be a comb filter. Comb is best for Auto mode, and for when there are many harmonics in a buzz. PARAM EQ Sets the removal filters to be a narrow notching parametric EQ. You may prefer the sound of these filters when there are few harmonics.
3.6 Description of Controls 3 THE OXFORD DEBUZZER SHARP/Q Adjusts the width or sharpness of the notches. When too sharp, the filters tend to ring. When too wide, the filters take out too much of the audio around the harmonics. So adjusting this is a matter of finding a suitable compromise. ATTENUATION Set this to the minimum attenuation that will make the hum or buzz inaudible. 3.6.4 Input and Output Panels TRIM Trim the input and output gain of the plug-in.
3.7 Signal and Control Flow Diagram 3 3.7 Signal and Control Flow Diagram 3.8 Stereo Behaviour THE OXFORD DEBUZZER For correct stereo operation, when instantiated into a stereo track the DeBuzzer has two independent repair circuits. There is a single mono detection circuit. www.sonnox.
3.9 Specifications 3.9 3.9.1 3 THE OXFORD DEBUZZER Specifications Sample Rates The supported samples rates are 44.1, 48, 88.2 and 96kHz only. 3.9.2 Delays and CPU Usage VST, AU and AAX Native 44.1 48 kHz 88.2 kHz 96 kHz DeBuzzer 7169 7169 14337 14337 Separately from the latency, the Restore plug-ins address CPU usage in various ways.
3.9 Specifications 3.9.3 3 THE OXFORD DEBUZZER Control Ranges Fundamental Frequency Ranges • 20 to 160 Hz • 160 to 1280 Hz • 1280 to 20 kHz Width of the Frequency Detect window LF MF HF Narrow 3% 2% 0.5% Normal 12% 8% 1.5% Wide 20% 12% 2% Resolution of Frequency Adjustment Normal 1.0 Hz Fine 0.01 Hz Shift-Fine 0.0001 Hz Bandwidth Range 75 Hz to 20 kHz Sharp/Q 16 to 160 Attenuation 0 dB to -144 dB Tone -96 dB to -6 dB Input Trim -12 dB to +12 dB Output Trim -12 dB to 0 dB www.sonnox.
4 4 4.1 THE OXFORD DENOISER The Oxford DeNoiser Basic Operation The Oxford DeNoiser removes wide-band noise from audio material using a variety of sophisticated techniques. The key to good de-noising lies in helping the user produce pleasing and accurate results, rather than encouraging over-aggressive use of the controls. The Oxford DeNoiser is based around the concept of a “noise profile”. White noise, for example, is flat all the way up the frequency spectrum.
4.1 Basic Operation 4 THE OXFORD DENOISER profile that is flat, generally speaking, whereas an audio track with brown noise embedded into it would need a noise profile that is higher at the LF end. The noise profile is used to gate-out components of the frequency spectrum that are below it, and keep the components that are above it. The overall level of the noise profile relative to the input signal is adjusted by the Threshold control to determine what is gated out.
4.2 4.2 Noise Threshold Bias Controls 4 THE OXFORD DENOISER Noise Threshold Bias Controls For additional manual control over the noise threshold profile, there is a 17-step threshold bias curve coloured red. This adjustment of the threshold profile works in all three modes – Auto, Freeze or Manual. Using this bias curve and the drag handles, you can easily make the threshold, and thus the noise removal, more sympathetic at critical frequencies.
4.4 DeHisser Section 4 THE OXFORD DENOISER yellow. The adjustment of the noise reduction works in all three modes – Auto, Freeze or Manual. Using this reduction bias curve you can easily reduce the amount of noise reduction at particularly critical frequencies, for example where piano transients are brightest and most obvious.
4.6 Mid/Side Mode 4.6 4 THE OXFORD DENOISER Mid/Side Mode Mid-Side channel configuration allows better control over the way a stereo signal degrades to a mono signal. This is important in broadcast where, for example, a stereo TV program needs to play correctly on a mono TV, or an FM radio broadcast can degrade to mono in less than perfect conditions, without phase effects. With a Mid-Side signal, you can simply drop the Side signal to create the mono signal.
4.7 Description of Controls 4 THE OXFORD DENOISER not cause a noticeable change in dominant noise content. DeNoising only the Side channel means that mono operation is entirely unaffected while stereo operation produces a cleaner stereo image without affecting the central sound. Secondly, recordings made with the Mid-Side microphone technique often have more noticeable noise in the Side signal because the Side signal is mainly ambiance.
4.7 Description of Controls 4.7.2 4 THE OXFORD DENOISER Graph Area Select the audio channel to view in the FFT display Toggle the law of the frequency axis.
4.7 Description of Controls 4.7.3 4 THE OXFORD DENOISER De-Hisser Panel Select the frequency above which the De-Hisser is active Adjust the reduction amount in dBs Enable and Disable the De-Hisser processing 4.7.4 Detect Panel In some situations this can help to remove musical noise. Adjust the ‘peakiness’ of the noise profile. AUTO — Enables automatic updating of noise profile and the noise profile level relative to the input signal. This is the most critical control to get right.
4.7 Description of Controls 4.7.5 4 THE OXFORD DENOISER Removal Panel This is a simple low pass filter with a fixed -18dB attenuation. It is active when the DeNoiser Enable and Master Enable are both active. Provides a way to adjust the level of the de-noised signal to compensate for any loss in level due to the denoising process. This makes it easier to perform with and without de- noising comparisons using the master IN button.
4.8 Signal and Control Flow Diagram 4 4.8 Signal and Control Flow Diagram 4.9 DeNoiser Stereo Behaviour THE OXFORD DENOISER For correct stereo operation, when instantiated into a stereo track the DeNoiser has two independent repair circuits. In Manual mode, there is only one noise profile that is applied to both stereo channels. In Freeze mode, there are two separate noise profiles, and both are displayed in the graph area.
4.10 Specifications 4.10 Specifications 4.10.1 Sample Rates 4 THE OXFORD DENOISER The supported samples rates are 44.1, 48, 88.2 and 96kHz only. 4.10.2 Delays and CPU Usage VST, AU and AAX Native 44.1 48 kHz 88.2 kHz 96 kHz DeClicker 3250 3328 6180 6336 DeBuzzer 7169 7169 14337 14337 DeNoiser 12288 12288 24576 24576 Separately from the latency, the Restore plug-ins address CPU usage in various ways.
4.10 Specifications 4.10.3 4 THE OXFORD DENOISER Control Ranges DeHisser Section Cutoff 3 kHz to 15 kHz Reduction 0 dB to -24 dB Broadband DeNoiser Threshold 24 dB to -24 dB Reduction 0 dB to -24 dB Tune 3 dB to 12 dB Makeup 0 dB to 12 dB HF Filter HF Cut 1 kHz to 22 kHz Reduction - 18 dB Bias Handles 18 dB to -18 dB Input Trim -12 dB to +12 dB Output Trim -12 dB to 0 dB www.sonnox.
5 5 PRESET MANAGER TOOLBAR Preset Manager Toolbar Sonnox Oxford plug-ins come equipped with their own onboard Preset Manager, which is displayed at the top of the plug-in window. The reasoning behind this is to allow increased portability of your presets across all the host applications, while also providing a consistent and versatile interface. While most host platforms allow creation and loading of presets, those host-created preset files are not portable between different host applications.
7 6 SYSTEM REQUIREMENTS Supported Platforms • Avid Pro Tools (AAX Native 32/64-bit) • VST hosts (32/64-bit) • AU hosts (32/64-bit) • Mac Intel OSX 10.6 or higher • Windows 7 and 8 (32/64-bit) 7 System Requirements For latest System requirements, please visit www.sonnox.com. All versions • Free iLok account • Appropriate product licence • iLok2 Pro Tools • Approved Digidesign/Avid CPU and hardware configuration • Pro Tools 10.3.5 (Native or HD), or higher VST Native • VST compliant host application (e.
8 8 COPYRIGHT AND ACKNOWLEDGEMENTS Copyright and Acknowledgements Trademarks and content copyright © 2007-present Sonnox® Ltd. All rights reserved. Sonnox® and the five dots logo are registered trademarks of Sonnox Ltd. This product is manufactured and supplied by Sonnox Ltd. This product is protected by one or more European and/or US patents. DIGIDESIGN, AVID and PRO TOOLS are trademarks or registered trademarks of Avid Technology Inc. VST is a trademark of Steinberg AG.