
Manual

6
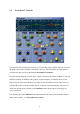
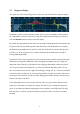
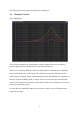
By default the vertical scale of the graph automatically adjusts itself to contain the yellow
response line or all active handles, whichever is the bigger. The ‘+’ and ‘-’ buttons on the left
hand side of the graph can be used to increase or decrease the scale of the graph. The default
graph scale, and other options, can be changed by clicking the Sonnox button and selecting
the Graphs entry on the drop-down menu.
Note that the response graph setup is saved and restored across instantiations.
2.3.1 Tips for Using the Response Display
The graph display is designed to be as intuitive as possible, but studying the following
paragraphs will definitely help to increase your workflow:
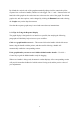
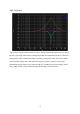
Click on a graph handle to move it – This means click on the handle with the left mouse
button, drag the handle with the pointer, and then unclick. Moving a handle will
automatically enable the corresponding section.
If the graph handle you want to use is hidden behind another handle – Use click +
Control key to grab the hidden handle ready for dragging.
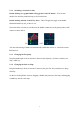
Whenever a handle is being used, the numeric readout displays of the corresponding section
will provide immediate feedback of which section is being used, and the precise values of
your adjustments.