User Manual

29
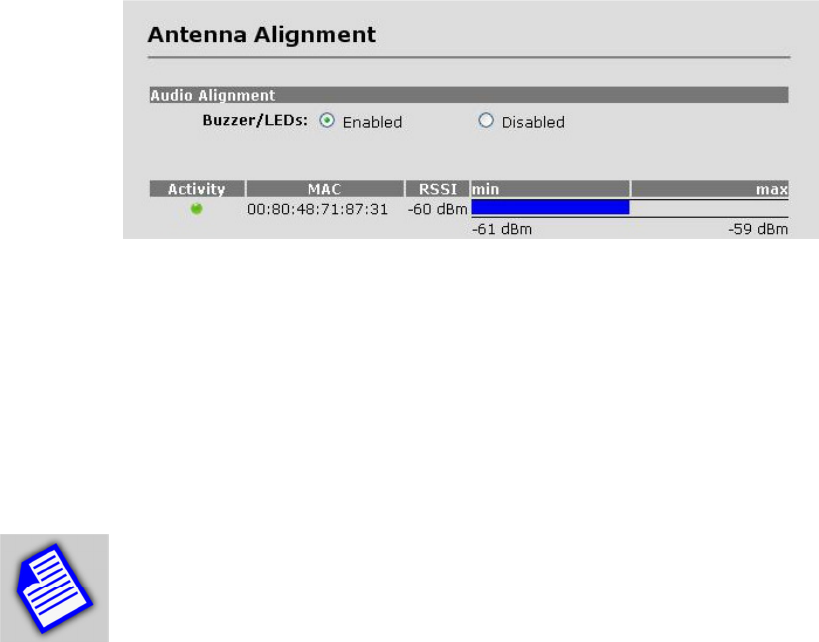
On this page is a dynamic display of the RF link state and local RSSI, in both numerical and
graphical format. In addition to displaying current RSSI, the bar graph format has an auto-scale
function which tracks the minimum and maximum achieved RSSI values since power-up.
NOTE – Fluctuations in RSSI values up to ±2 dB should be expected. This should
be considered normal behavior of the radio.
12. Verifying Operation
12.1 Main Status Screen
The basic status can be viewed in the Main Status screen:


