User Manual

27
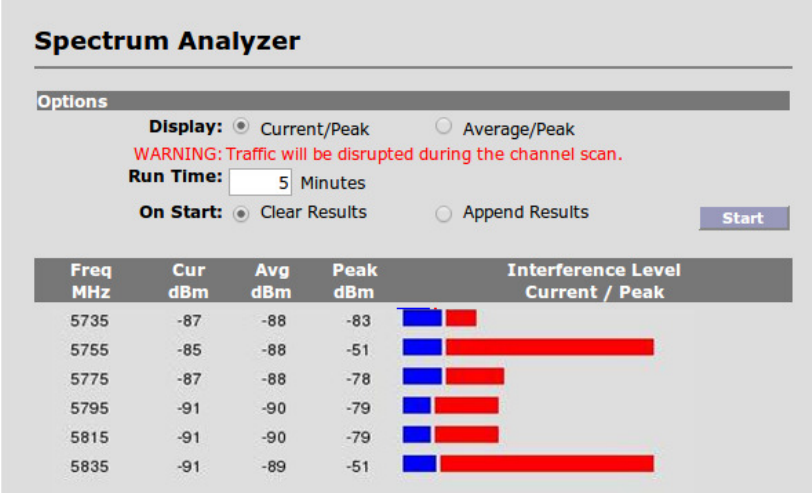
In the example screen shown above, the scan shows high levels of interference at 5755 and
5835 MHz, and these channels would be unsuitable choices for satisfactory performance. While
any of the remaining 20 MHz channels would be preferable, the channel centered on 5795 is a
better candidate, as it is further from the strongest interferers.
There are two display options (Current/Peak and Average/Peak) to assist with analysis.
Alternating between the two modes will not erase the collected data.
There are also two scan modes. The first, Clear Results, removes all historical scan data and
reports only information gathered during the current scan. Alternatively Append Results can be
selected if displaying aggregated results across multiple scans is desired.
To begin spectrum analysis, click Start button. The unit will scan through the available channels
and display the results on the bottom of the screen. Numerical results, measured in absolute
power (dBm) will indicate the interference and noise levels based on received signals from each
channel. The blue bar indicates either the current or average power level (depending on mode
selected) and the red bar indicates peak power received during the test interval.
After 5 minutes of scanning, the radio will automatically disable the scan and return to normal
operation when the configured Run Time expires. A scan can be terminated sooner by clicking
the Stop button on radios with local Ethernet access.


