
User`s guide

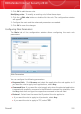
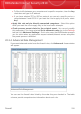


You can see the total traffic sorted by application. For each application, you can see
the connections and the open ports, as well as statistics regarding the outgoing &
incoming traffic speed and the total amount of data sent / received.
If you want to see the inactive processes too, clear the Hide inactive processes
check box.
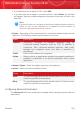
The meaning of the icons is as follows:
⚫ Indicates an outgoing connection.
⚫ Indicates an incoming connection.
⚫ Indicates an open port on your computer.
The window presents the current network / Internet activity in real-time. As
connections or ports are closed, you can see that the corresponding statistics are
dimmed and that, eventually, they disappear. The same thing happens to all statistics
corresponding to an application which generates traffic or has open ports and which
you close.
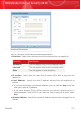
For a comprehensive list of events regarding the Firewall module usage
(enabling/disabling firewall, traffic blocking, modifying settings) or generated by
the activities detected by this module (scanning ports, blocking connection attempts
or traffic according to the rules) view the BitDefender Firewall log file by clicking
View Log. The file is located in the Common Files folder of the current Windows
user, under the path: ...BitDefender\BitDefender
Firewall\bdfirewall.txt.
If you want the log to contain more information, select Increase log verbosity.
Firewall
230
BitDefender Internet Security 2010