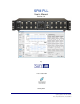
SPM PLL User’s Manual Version 1.8 by In association with January 2012 1040, avenue Belvédère, suite 215 Québec (Québec) G1S 3G3 Canada Tél.
1 SPECIFICATIONS..........................................................................................4 1.1 Power Supply .......................................................................................................................4 1.2 USB .......................................................................................................................................4 1.3 Analog Inputs ................................................................................................
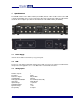
1 Specifications The GXSM software for the SPM controller (model Mk3) includes a PLL module. However, the SPM controller (model Mk3) can be used as a stand alone PLL when using the PC software described in this document. The next figures present the front and the back of the SPM controller (model Mk3): 1.1 Power Supply The PLL works with an external 5V (+-5%) power pack. 1.2 USB The PLL is controlled by a Windows PC through a USB connection. The high-speed USB 2.
1.4 Analog Outputs Number of Outputs: Resolution: Noise: • 20MHz bandwidth: • 20 kHz bandwidth: Offset Drift with Temperature: Gain Drift with Temperature: Offset Drift with Time: Sampling Rate: Analog Output Bandwidth: Output Type: Dynamic Range: Source/Sink ability: Anti-Aliasing Filter: Group-Delay: • Output #1 and #2: • Output #3 and #4: • Output #5 SPM - PLL User’s Manual 5 16 bits Up to 55 mV pk-pk on FFFFH- 0000H alternating code sequence.
1.5 PLL Performance PLL Module Specifications Input Range Output Range Frequency Range Resonator Test Board +-10V +-10V (external 1/100 and 1/1000 attenuators provided) 3.2 kHz to 75 kHz An active resonator board is included with the SPM controller for easy testing and setup of the PLL module PLL Output Signal Ranges Excitation Frequency: +-2.85 mHz to +-23.9 kHz (Stand-Alone Operation) to +-10 V Excitation Amplitude: +-1.19 µV Resonator Phase: +-6.83 µDeg to +-57.3 Deg Resonator Amplitude: +-1.
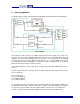
2 Theory of Operation The diagram of PLL running on the Signal Ranger Mk3 DSP board is illustrated in the following figure: PLL schematic The synthesizer sends a sine wave on output #1. Input #1 measures the output of the resonator. The phase detector measures the amplitude and the phase of the resonator output signal, with respect to its excitation. The phase detector algorithm measures the phase of the resonator alone, automatically correcting for the phase of board’s digital and analog chains.
3 Software and Hardware Installation Note: The software must be installed before connecting the PLL unit to a PC. The software installs the USB driver automatically. Windows XP, Windows Vista and Windows 7 are supported on a 32-bit or 64-bit PC. To install the software, launch the SoftdB_SPM_PLL_1_8.
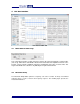
4 PLL User Interface PLL interface: Main Tab 4.1 Phase Detector Time Cst (s) This control adjusts the time constant of the phase detector. We suggest keeping time constant to 20us (fast set-up), which allows a bandwidth of about 8 kHz. Note that the auto-adjustment functions for the PI gains of both controllers (amplitude and phase) automatically set the time constant to 20us. This way, the bandwidth of the controller is only limited by the PI gains and the LP filter. 4.
Resonator Sweep Interface The resonator sweep interface automatically sets the time constant of the phase detector at 1ms to obtain a precise measurement of both the phase and amplitude. The original time constant for the phase detector is replaced after the sweep measurement. Before starting the measurement, the start and stop frequencies must be adjusted along with the frequency resolution and the excitation amplitude.
4.3 Operation Set-up Controls PLL interface: Operation Set-up Controls These controls allow the set-up of the reference values and the configuration of the analog output signals. Up to four analog signals can be generated by the PLL. For each signal, the reference, the range and the output number can be adjusted. A low pass filter is applied on the output signals and the frequency cut-off can be adjusted from a menu.
4.5 Set-Points These controls adjust the set points for the phase and the resonator amplitude. Note that the phase set point is always the reference phase. So, the set-point adjustment for the phase is done through the phase reference control (see the Operation Set-up controls). This way, the phase controller always works centered around zero. 4.6 PI Controls and Switches The sign and the gain of the Proportional and Integral factors can be adjusted with these controls for both controllers.
Select the desired bandwidth and click ok. Then, the interface will automatically set the LP filter (for the phase/frequency), the PI gains and the time constant of the phase/amplitude detector to reach the desired bandwidth. For the amplitude controller, the following dialog box allows specifying the desired bandwidth: To be able to determine the proper PI gains, the auto-adjustment function must know the gain at the resonance and the Q factor of the resonator.
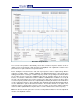
Phase controller test interface (Resonator Phase Tab) In the first tab (Resonator Phase Tab), the top curve presents the step response and the bottom curve is the closed-loop frequency response of the derivative of the step response (i.e. the spectrum of the closed-loop impulse response). This curve allows the evaluation of the controller bandwidth. The second tab presents the excitation frequency response. This is the output of the phase controller.
The resonator phase The resonator amplitude The excitation frequency A first order low pass filter is applied. The filter that can be adjusted with the LP filter applied on Freq./Phase/Amp control (see Operation Set-up controls). 4.9 Time Signal Graph and Signal Selection These graphs present various signals of interest in real-time. The selection of the signals is done through the Signal Select menu.
Signal Resonator Output Excitation Resonator Phase (raw) Excitation Freq. (raw) Resonator Output Amp. (raw) Excitation Amp. (raw) Excitation Freq. (filtered) Resonator Phase (filtered) SPM - PLL User’s Manual Description Resonator output time signal in V. This is the signal measured by the DSP board on input #1. Excitation time signal in V. This is the signal generated by the DSP board on output #1. Resonator phase in degrees, as measured by the phase detector.
Resonator Amplitude (filtered) Excitation Amplitude (filtered) Output #2, #3, #4 and #5 phase of board’s digital and analog chains. For this signal the Signal control can be used to present the absolute value or the shift value. The reference value in the Operation Set-up tab is used to compute the shift value. Filtered resonator output amplitude (in V). The low pass filter is applied to lower the noise on this signal.
Amplitude controller test interface (Resonator Amplitude Tab) 4.11 Save and Recall Configuration Files These buttons save and recall a configuration. All PLL parameters are saved in the configuration file. When a configuration is recalled, both controllers are automatically stopped.
GPIO Connectors The GPIOs are located on two dB-25 connectors at the back of the instrument: Left Connector 13 Gnd 12 Gnd 25 Gnd 11 Gnd 24 Gnd 10 QEP0_B 23 Gnd 9 QEP0_A 22 Gnd 8 GPIO_0(7) 21 Gnd 7 GPIO_0(6) 20 Gnd 6 GPIO_0(5) 19 Gnd 5 GPIO_0(4) 18 Gnd 4 GPIO_0(3) 17 Gnd 3 GPIO_0(2) 16 Gnd 2 GPIO_0(1) 15 Gnd 1 GPIO_0(0) 14 Gnd 10 QEP1_B 23 Gnd 9 QEP1_A 22 Gnd 8 GPIO_0(15) 21 Gnd 7 GPIO_0(14) 20 Gnd 6 GPIO_0(13) 19 Gnd 5 GPIO_0(12) 18 Gnd 4 GPIO_0(11) 17 Gnd 3 GPIO_0(10) 16 Gnd 2 GPIO_0