
Owner's manual

8
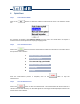
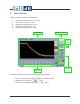
Step 4 Visualize the Measurement
Click on the button to select the display from the menu. The available displays are:
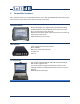
Decay
This display shows the time decay for a given frequency band or for the global.
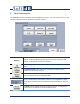
Spectrum
This display shows a selected value from each frequency band in a bar graph form.
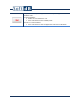
Data
This display shows all values for all frequency bands in an array.
Further information about each display is available in section 6.5, p. 12.