
Operator's Manual


40
Programming and oPeration
Programming
and oPeration
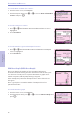
To view the Given and PCA dose counters:
1. From the Home screen, select Reports.
2. From the Reports menu, press U or D to choose Given and PCA Dose
Counters and press S.
To clear the total given counters:
1. Press U or D until the Given Amount and Given Volume section is
highlighted.
2. Select Clear Given.
To clear the PCA doses given and attempted counters:
1. Press U or D until the PCA Doses Given and PCA Doses Attempted
section is highlighted.
2. Select Clear Doses.
PCA Dose Graph (PCEA Dose Graph)
This screen displays the number of doses attempted and given in
30 minute increments starting from the current time to 8 hours in the past
or to the start of a new protocol or patient. The PCA dose graph can be
viewed at any time, with the pump running or stopped.
In this example, the patient has attempted 7 doses and 3 of those doses
were given.
This is a good place to review the number of attempted doses for a
particular time frame.
To view the PCA dose graph:
1. From the Home screen, select Reports.
2. From the Reports menu, press U or D to choose PCA Dose Graph and
press S.