
Manual
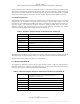
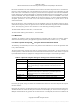
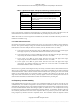
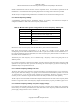
Table Of Contents
- ANSI C63.17-2006 Front Cover
- Title page
- Introduction
- Notice to users
- Participants
- Contents
- American National Standard Methods of Measurement of the Electromagnetic and Operational Compatibility of Unlicensed Personal Communications Services (UPCS) Devices
- 1. Overview
- 2. Normative references
- 3. Definitions, symbols, acronyms, and abbreviations
- 4. Radiated and conducted emissions test methodology
- 4.1 Test facilities and equipment
- 4.2 Test configurations and setup
- 4.3 Transmitted power and monitoring threshold limits
- 4.4 Limits for radiated and conducted tests
- 4.5 Conducted measurements of products with identical collocated transmitting and monitoring antennas
- 4.6 Conducted measurements of products with collocated transmitting and monitoring antennas of different types
- 4.7 Conducted measurements of products with arbitrarily placed transmitting and monitoring antennas
- 4.8 Radiated measurements of products with identical collocated transmitting and monitoring antennas
- 4.9 Radiated measurements of products with collocated transmitting and monitoring antennas of different types
- 4.10 Radiated measurements of products with arbitrarily placed transmitting and monitoring antennas
- 4.11 Manufacturer’s declarations and descriptions
- 5. Measurement instrumentation
- 6. RF measurements
- 7. Monitoring tests
- 8. Time and spectrum window access procedure
- 9. Test report
- 9.1 Test report contents
- 9.2 Applicable standards
- 9.3 Equipment units tested
- 9.4 Test configuration
- 9.5 List of test equipment
- 9.6 Units of measurement
- 9.7 Location of test site
- 9.8 Measurement procedures
- 9.9 Reporting measurement data
- 9.10 General and special conditions
- 9.11 Summary of results
- 9.12 Required signatures
- 9.13 Test report appendixes
- 9.14 Test report disposition
- Annex A (informative) 47CFR15, Subpart D—Rules and test cases for UPCS devices
- Annex B (informative) Radiated and conducted measurement of power output and monitoring thresholds
- Annex C (informative) Options for implementing the tests of Clause 7 and Clause 8

ANSI C63.17-2006
Methods of Measurement of the Electromagnetic and Operational Compatibility of UPCS Devices
Except as otherwise noted, if the EUT is capable of operation on more than one frequency within the band,
then for RF measurements the standard test frequencies shall be the lowest frequency within the band for
which the EUT is capable of operation, the highest frequency within the band for which the EUT is capable
of operation, and the frequency nearest the center of the band for which the EUT is capable of operation.
6.1.2
Table 2
Peak transmit power
The following test method may be used to verify that the EUT’s peak transmit power does not exceed the
permitted value. The equipment is configured as shown in Figure 3 and according to Table 2. The peak
transmit power is the maximum of the RMS power during a transmit burst. Typical spectrum analyzers are
frequency selective, peak-responding voltmeters calibrated to display the RMS value of a sine wave.
Therefore, using the peak detection function on most spectrum analyzers will produce the intended
measurement when the bandwidth and trigger functions are properly set.
—Spectrum analyzer settings for determining the peak power
RBW ≥ Emission bandwidth
Video bandwidth ≥ RBW
Span Zero
Center frequency Nominal center frequency of channels
Amplitude scale
Log (linear may be used if analyzer has sufficient linear dynamic range
and accuracy)
Detection Peak detection
Trigger Video
Sweep rate Sufficiently rapid to permit the transmit pulse to be resolved accurately
The RBW setting for this test must be adjusted by repeating this test and using increasing values of the
RBW until there are negligible changes (within ± 0.5 dB) in the measured values of the maximum power.
The measured maximum shall be less than P
limit
, or the EUT fails.
6.1.3
Table 3
Emission bandwidth B
The equipment is configured as shown in Figure 3 and according to Table 3. The EUT shall transmit in a
burst mode (shall not be configured to transmit continuously) so that transient effects associated with the
burst edges are captured by the emission bandwidth measurement.
—Spectrum analyzer settings for measurement of emissions bandwidth B
RBW
Approximately 1% of the emission bandwidth (a rough estimate may
be obtained from peak power level measurement, or use
manufacturer’s declared value)
Video bandwidth ≥ 3 × the RBW
Center frequency Nominal center frequency of channel
Span ≥ 2 × the expected emission bandwidth
Sweep time Coupled to frequency span and RBW
Amplitude scale Log
Detection Peak detection with maximum hold enabled
16
Copyright © 2007 IEEE. All rights reserved.
Licensed to Sid Sanders. ANSI order X_30788. Downloaded 11/19/2007 2:45 PM. Single user license only. Copying and networking prohibited.