
Setup Using SAS Monitor Manual

SmarTek Systems (www.smarteksys.com)
13
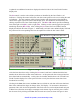
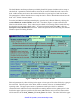
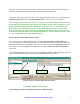
Click the Sensor/Show SAS Lane Power vs Time menu item to open the SAS Lane Power vs
Time Plot Display Window (Figure 7). To select each lane for setup:
Click the Pause button,
Click the Lane Selection option ,
Click the Continue button.
After selecting a lane for setup, adjust the lane sensitivity by left clicking in the upper or lower
part of the Lane Sensitivity field (1-Sens, 2-Sens, etc. to the right of the plotting area). This will
cause the Red Trace (Calculated Detection Threshold) to move up or down in 0.25 db
increments. Adjust the Lane Sensitivity for each lane until the Red Trace is approximately 3 to
5 db above the Cyan Trace for the Minimum Sensitivity Threshold (T-Minimum Sensitivity).
The Red Trace will track below the Blue Trace (Avg Peak Value) by the amount of the Lane
Sensitivity. Typical values for Lane Sensitivity are 4 to 6 db.
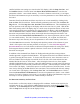
Click the Close button to close the SAS Lane Power vs Time Plot Window. On the SAS
Monitor and Setup main display click the Save Par , and the Send Par button.
Calibrate Speed Estimates for Each Lane
Figure 7 Setting Detection Sensitivity for Each Lane
Lane Sensitivity
T-Minimum
T-Maximum