TM S SmarTek Systems, Inc. TM S 14710 Kogan Drive Woodbridge, VA 22193 703-680-6554 Sales 410-315-9727 SmarTek Acoustic Sensor - Version 1 (SAS-1) Installation and Setup Guide Part-F SAS-1 Setup Using SAS Monitor and Setup Software 5 August 2005 Note: In all cases, do not work or position equipment over an active traffic lane. Working over active lanes presents a hazard to the installer and to travelers using the highway.
(This Page Intentionally Left Blank) SmarTek Systems (www.smarteksys.
Connecting to SAS-1 via the SAS-CT and Establishing Communication Connect the SAS-CT (RJ-45) to the PC comm port (DB-9) using the supplied serial cable. Check that power to the SAS-CT is present and the fuse is in place on the SAS-CT. Run the SAS Monitor and Setup program on the PC by clicking Start/Programs/SmarTek Systems/SAS_Monitor_V6. On the Introduction screen, click Direct. All SAS Monitor and Setup parameters are stored in a parameter file (user_specified_name.
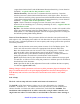
Click the menu item Settings/Comm Port/Setup Comm Port to set the PC Comm Port parameters. The Comm Port Number for a laptop PC is typically 1 or 2 for native comm ports or may be some other number if a USB to Serial Comm Port converter is used. Set the Comm Port Number to the appropriate value corresponding to the serial comm port.
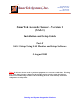
Operating Mode – Flow, Azimuth Detect, Single Relay,Flow/Truck Type or Dual Loop Relay (with loop separation). Set this to the desired power on mode for operation. Monitor Mode – Freeway (more dynamic detector settings) or Intersection (less dynamic detector settings with up to a 2 second detection on hold time). Set this according to required operation (monitor Freeway traffic or Intersection Stop Line Presence).
Dspl Sens - Controls the display of data on the TAI display. Higher values of Dspl Sens cause more acoustic data to be displayed. This parameter is only used for the SAS Monitor and Setup Traffic Acoustic Image (TAI) display. A typical value for this parameter = 25. Scale - This is a scaling parameter for converting acoustic power measurements (intensity) into the levels of color (green) for the TAI display.
(“upper detection threshold”) and the Maximum Detection Sensitivity (“lower detection threshold”). A typical value for this parameter = 24.75. Min Det Sensitivity - Sets the SAS-1’s minimum detection sensitivity. Detection sensitivity increases (“detection threshold”decreases) with higher values. The SAS-1 vehicle detector sensitivity always operates between the Minimum Detection Sensitivity (“upper detection threshold”) and the Maximum Detection Sensitivity (“lower detection threshold”).
SAS0001. For example, a traffic monitoring station with three SAS-1s connected to the roadside cabinet controller using a single home run cable, should have the SAS IDs set to SAS0001, SAS0002, and SAS0003. Each SAS ID must be set before the units are “wired” together on the same home run cable or wireless link. If multiple SAS-1 units are installed sharing the same home run cable and each have the same SAS ID, then communication with each SAS-1 is not possible.
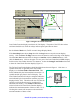
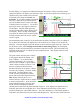
Click to Increase/Decrease Field for Lane Finder Function Click to Increase/Decrease Number of Lanes/Zones to Set Figure 2 Begin Lane Finder Functions Lane Finder Function display area below the TAI display. The peaks of the LFF show where each lane should be set, while the valleys indicate quiet space between lanes. Set the Monitor Mode to 1 (Traffic Acoustic Image Display Mode). If the Start/Stop button shows Stop then click the Stop button to stop the current display activity.
For this display, it is important to understand the point of reference. Move the mouse pointer slowly through the TAI display area from left to right. As the mouse pointer moves through, you should see the green readout to the left of the TAI display area change from Pixel=1 to Pixel=181. If you where standing just behind the SAS-1 (same end as the strain relief) to your left would be Pixel=1 and to your right would be Pixel=181 (Figure 3).
is updated, two additional controls are displayed on the left side of the Lane Finder Function display area. The Set control is used to select all lane positions as identified by the Lane Finder’s red indicators. Clicking this control will cause each lane center position to be set according the each red indicator. The lane numbers will be selected starting with the magenta colored number shown in the upper right of the Lane Finder display area.
satisfied with the zone settings (as viewed on the TAI display), click the Stop, Save Par , and the Send Par buttons. Click the menu item Sensor/Write SAS Parameters to save the new parameters to SAS-1’s non-volatile memory. For SAS-1 firmware version SAS_131 or higher, the Write SAS Parameters step is not necessary to save the parameters to non-volatile memory in the SAS-1. Detection Zone/Lane Positions and Sizes may also be set or reset manually by clicking in the Cntr and Size field for each lane.
Click the Sensor/Show SAS Lane Power vs Time menu item to open the SAS Lane Power vs Time Plot Display Window (Figure 7). To select each lane for setup: Click the Pause button, Click the Lane Selection option , Click the Continue button. Lane Sensitivity T-Maximum T-Minimum Figure 7 Setting Detection Sensitivity for Each Lane After selecting a lane for setup, adjust the lane sensitivity by left clicking in the upper or lower part of the Lane Sensitivity field (1-Sens, 2-Sens, etc.
Set Detection Sensitivity for Each Lane After setting up the SAS-1 detection zones/lanes and the lane by lane detection sensitivity, the speed estimate for each lane can be calibrated. If the Start/Stop button on the main SAS Monitor and Setup display shows “Stop”, click the Stop button to stop the current display activity. Now click in the upper or lower part of the Mode display field to set the SAS Monitor display to Mode 1 (TAI display) and then click the Start button to start the TAI display.
the Send Par button, click it. At this point, the updated SpCal parameters have been sent to the SAS-1 unit and saved in non-volatile memory. To manually calibrate the speed estimates for each lane perform the following steps: Enter the known free flow speed (mph) for each lane by clicking in the upper or lower part of the FF Speed field.
The SAS Monitor and Setup software provided by SmarTek Systems includes tools to setup or edit the SAS-1 parameters and information stored in the Archive Header Records, retrieve the SAS-1 ardhived data, and convert the archived data file to a growing list of end user formats. The paragraphs to follow describe how to setup the SAS-1 Archive Header Records and use the SAS-1 as a Vehicle Counter Station.
right area specifies the file name of an associated Header file (.hdr) that may be used when the SAS-1 Archive Data File (.ahx) is converted to a specified end user format. Both of these file names must be eight (8) characters or less and must be valid names relative to Windows file name rules.
with the Minimum Detection Sensitivity. A typical value for the Average Peak Value Cap parameter would be 10 db as shown in Figure 9. It is unlikely that this parameter value would ever need to be any value other than 10 db for each lane. To save the edited Archive Header File (.hhx) to the \SAS_Monitor_V6\ Arch_Data\ subfolder, click the File/Save Archive Header File menu item. Specify the desired file name using the standard Save File Dialog Window.
operation. The archive storage is circular so that when the archive grows to the maximum size, the oldest measurement data is discarded to make room for the most recent. The SAS-1 will collect traffic flow data for all 5 lanes and update the archive as specified by the Update Period parameter in the Archive Header File (5, 10, 15, 20, 30, or 60 minutes). After sending a header file to the SAS-1 or setting the SAS-1 date and time, data archiving begins after the next full data write period.
To convert the SAS Archive Data File (.ahx) to a spread sheet ready file or another specified end user format, click the Archive/Decode SAS Archive menu item. This opens the SAS Archive File Conversion Window (Figure 10). Click on the file for conversion in the middle pane to select the file. Click the Add button to add the selected file to the conversion list in the right pane. Click the Add All button to select and add all files to the conversion list.
Menu Options Lists The following is a complete list of menu options in the SAS Monitor and Setup software. File Menu Log Flow Measurements - Enables/Disables creation of a spreadsheet ready text measurement file in the \Arch_Data\ sub-folder (SASxxxx.log). When enabled new data is appended to older data in the file. Enable Manual Measurements - Enables the collection and logging of manual vehicle counts. This capability uses a special parallel port interface (with buttons) for counting vehicles.
Communication Truck Roll Over T-Box – Opens the communication/parameter setup window for the Truck Roll Over application using the SAS-1. This is a special application using the SAS-1. Sensor Menu Get SAS ID – Retrieves the SAS ID for the connected SAS-1. Get SAS Parameters - Retrieves current SAS-1 parameter settings and displays them in appropriate SAS Monitor and Setup parameter fields.
Archive Menu Decode SAS Archive – Opens a dialog window for selecting SAS-1 archive files (.ahx) for conversion to spread sheet ready text files (.atx). Edit SAS Archive Header - Opens an editor window for editing SAS-1 archive header parameters including commercial and tractor trailer truck lengths and the archive update period. Command Buttons Menu Programmable Command Buttons – Displays 30 command buttons (29 are programmable) on the right side of the SAS Monitor and Setup main display.