
User's Manual
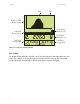
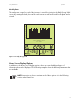
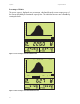
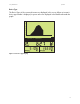
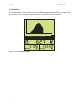
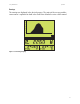
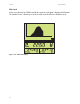
Table Of Contents
- Revision History
- Safety and Hazard Symbols
- Warnings
- Other Symbols
- Warranty
- Introduction
- Unpacking
- Installation and Setup
- Commissioning
- Operation
- Power Supply
- The Home Screen
- Home Screen Display Options
- Setup Options
- Setup Menu
- Using the USB Port
- Sunny Data Control
- Figure 1-29 Guide to SDC Overview Screen
- Figure 1-30 Sunny Data Control Settings Window
- Figure 1-31 Current Plant Tree Window with Measuring Channels
- Figure 1-32 Fading in Devices
- Figure 1-33 Arrangement of the Device Windows
- Figure 1-34 Example of One Window per Device
- Figure 1-35 Channel Selection Window
- Troubleshooting
- Specifications

Sunny Beam Manual Operation
15
The Home Screen can also display the following information in graph format:
• Daily total plant power output
• Daily single inverter power output
• Daily total energy yields for the last 31 days or of the current month
• Internal battery voltage level
Default View
The Sunny Beam comes set from the factory to display the daily yield and total yield of the
entire plant in the text area. The total plant power for the day is displayed in the graph area.
The same data for the individual inverters can be displayed by rotating the knob.
Scrolling Through Screens
When scrolling through screens, the Sunny Beam shows first the combined output of all
inverters being monitored. Then, by rotating the knob one click, it shows the individual power
outputs for the individual inverters. For example, if there are two inverters, it shows: Combined
power, inverter 1 power out, inverter 2 power out. Then it shows combined energy yield
followed by the individual energy yields for each inverter. This sequence repeats for any of the
parameters that are selected to be displayed.
When the home screen is displayed, any activated parameters will be shown in the black bar
beneath the graph. Each item will be displayed briefly before the Sunny Beam automatically
scrolls to the next item.
NOTE: The graph shows the power output of the plant or individual inverters over
the course of the day. If at any time the Sunny Beam fails to communicate with any
of the inverters, that portion of the graph will be grayed out.