
Data Sheet

7 / 16
Copyright (c) 2009-2013 RoboPeak Team
Copyright (c) 2013-2016 Shanghai Slamtec Co., Ltd.
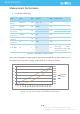
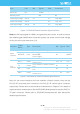
Measurement Performance
o For Model A1M8 Only
Figure 2-1 RPLIDAR A1 Performance
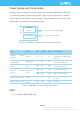
Note: the triangulation range system resolution changes along with distance, and
the theoretical resolution change of RPLIDAR A1 is shown as below:
Figure 2-2 The Trend Graph of RPLIDAR A1 Resolution
0.00%
0.02%
0.04%
0.06%
0.08%
0.10%
0.12%
0.14%
0.16%
0.18%
0.20%
0
2
4
6
8
10
12
10
290
570
850
1130
1410
1690
1970
2250
2530
2810
3090
3370
3650
3930
4210
4490
4770
5050
5330
5610
5890
Resoultion
Precent
Specification
Item
Unit
Min
Typical
Max
Comments
Distance
Range
Meter(m)
TBD
0.15 - 12
TBD
White objects
Angular
Range
Degree
n/a
0-360
n/a
Distance
Resolution
mm
n/a
<0.5
n/a
<1.5 meters
<1% of the distance
All distance range*
Angular
Resolution
Degree
n/a
≤1
n/a
5.5Hz scan rate
Sample
Duration
Millisecond(ms
)
n/a
0.5
n/a
Sample
Frequency
Hz
n/a
4000
8000
Scan Rate
Hz
1
5.5
10
Typical value is
measured when
RPLIDAR A1 takes 360
samples per scan