
User guide


7
SKC Real Time Monitor Window
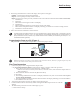
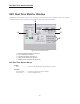
Real Time Monitor Display
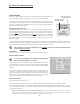
The Real Time Monitor display (Figure 5) shows the operating status of the connected
pump.
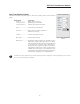
Monitor Display Cell Readout
Mode .............................RUN: pump in run state
(Constant Flow or HOLD: pump in hold state
Constant Pressure) FAULT: pump in fl ow fault state
Flow ...............................current fl ow rate in mL/min
Pressure ........................back pressure in inches (ins) H
2
O, or
millimeters (mm) Hg
Volume ..........................volume of air pumped in mL
Run Time ......................total run time of pump
Ba ery icon ..................graphically displays ba ery life. The ba ery life is
indicated by a light colored bar with low (-) charge
indicated on the le side and full (+) charge indicated
on the right side. A ba ery with a full charge is
displayed by the length of this light colored bar. A
long light colored bar (closer to the + end) represents
a ba ery near a full charge. A short light colored bar
(closer to the - end) represents a ba ery near depletion.
A dead ba ery is displayed as a solid black bar
The data in the cells is updated every 5 seconds. If pump operation is changed, the cells will display the previous values
for up to 5 seconds before they are updated.
Figure 5. Real Time Monitor
Display