
Instruction manual


Display presentations
DISPLAY PRESENTATIONS
The information provided by the PI Remote/Depth sensor is
shown on the PI catch monitoring system’s colour display. Two
presentations are available:
• Numerical presentation
• Graphical presentation with or without echogram
Numerical presentation
The numerical presentation of the PI Remote/Depth data is
automatically shown in the relevant display modes. It is identical
to the presentation provided by the PI Depth sensor.
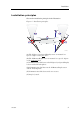
Figure 8 Numerical presentation, example
18
D1 [m]
25.6
q
(CD012206G)
A
B
C
E
D
F
G
H
(A) Sensor identification
(B) Unit of measurement
(C) Depth
(D) Depth change per minute
(E) Arrow pointing “down” means that the depth i
s increasing,
arrow pointing “up” means that depth is de
creasing.
(F) Visual alarm
(G) Interference warning
(H) Sensor transmission indicator
When the readings are stable, the digi
tsareshowninblack
colour. If the contact is lost, the ch
aracters *** are shown in grey.
If the depth is out of range, the disp
lays shows ???.
Graphical presentation on PI32
This section contains a proced
ure to explain how you can set
up the PI32 to show you a graphi
cal presentation of the PI
Remote/Depth data providin
gdepthmarkers.
316870/A 17