
Installation manual


Displayviews
Trendviews
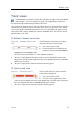
TheTrendviewisopenedbyclickingtheiconinthetoprightcorneroftheSensor
viewrectangle.Theviewcomprisesagraph.Thegraphdisplaysthehistoric
developmentoftheinformationprovidedbythesensor.
Onceopened,thegraphisplacedontheleftsideofthescreen.Ifmorethanonegraphis
opened,theyareplacedontopofeachother,intheorderyouopenthem.Thevertical
sizeofeachgraphisautomaticallyadjusted.Thecurveprovidedbythegraphusesthe
samecolourthatisusedtoidentifythesensorintheSensorview.Thecolourischosen
automaticallybythePI50.
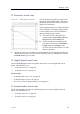
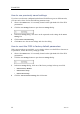
PIBottomContacttrendview
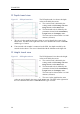
Figure30PIBottomContacttrend
view
ThePIBottomContacttrendviewshows
whenthesensorhasbeenactivated.
aTheverticalscaleisxed.
bThehorizontalscaleisdenedbythe
parameterselectedintheTrendHistory
LengthbuttonontheDisplaymenu.
Thetimecanbeselectedfrom5to1440minutes(24hours).
cThecurveinthegraphhasthesamecolourasusedtoidentifythesensorinthe
Sensorview.Thelabelattherightendofthecurveidentiesthesensor’sLabelID
andthetypeofsensor.
dThecurvesimplyshowswhenthesensorhasbeentriggered.
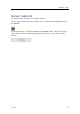
PICatchtrendview
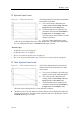
Figure31PICatchtrendview
ThePICatchtrendviewshowswhenthe
sensorhasbeentriggered.
aTheverticalscaleisxed.
bThecurveinthegraphhasthesame
colourasusedtoidentifythesensorintheSensorview.Thelabelattherightendof
thecurveidentiesthesensor’sLabelIDandthetypeofsensor.
cThecurvesimplyshowswhenthesensorhasbeentriggered.
328457/A
59