
User manual


SimradES70
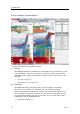
2Clickoneofthetransducertabs.Observethatonlytheechogramfromtheselected
frequencychannelisshown.
Bydefault,twoechogramsareshownforeachfrequencychannel.Thetop
echogramissurfacerelated,whilethebottomechogramisbottomrelated.Several
echogramtypesareprovided.
aSurface
Theechogramisrelatedtotheseasurface.Startdepth(upperechogram
boundary)andverticalrange(acrossechogram)aremanuallyselectedbythe
StartDepthandRangebuttonsontheMainmenu.
Thebiomassisautomaticallycalculatedbasedonchoicesyoumakeinthe
CalculationIntervaldialog;withinagiventimeframe,adenednumberof
pings,oraportionoftheechogramview.Thedataisthentakenfroman
echoareastartingimmediatelyafterthetransmitpulse,andendingjustover
thedetecteddepth.
Ifyouhavelimitedyourverticalrange(usingtheRangeandStartRange
settings),theresultingareaisusedforthebiomasscalculation.Iftheseabed
isclearlydenedwithauniquebottomdetection,thebottomechowillnot
be
includedinthecalculations.Therefore,ifyouswitchthebottomdetectoroff,
thebottomechowillbeincludedinthecalculation.
→Biomassinformationpaneonpage136
→StartRangeonpage160
→Rangeonpage158
bBottom
Theechogramisrelatedtothedetectedbottom.Stopdepth(lowerechogram
boundary)andverticalrangearemanuallyselectedbytheStartDepthand
RangebuttonsontheMainmenu.Theechogramisonlydrawnforpingshaving
asuccessfulbottomdetection.
ThebiomasscalculationismadeinthesamewayasforSurfaceechograms.
cPelagic
ThisechogramisnearlyidenticaltotheSurfaceechogram.However,the
biomassiscalculatedinadifferentmanner.
Thebiomasscalculationsarenotrestrictedbythebottomdetection.This
meansthatthebottomechowillbeincludedincalculationsifitappearswithin
thechosenrange.
Example1Biomasscalculation
Ifyouareinvestigatingalargeschoolofpelagicsh,settheStartRange
andRangetoenclosetheschool.Iftheschoolislargeenough,aSurface
echogrammaymistakeitforbottom,andthebiomassreadingswill
bewrong.ThePelagicechogramwillhoweverdisregardthebottom
detection,andgiveacorrectestimateofthebiomass.
dTrawl
30
338106/C