
User manual


Displayviews
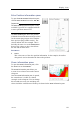
Thelargenumberabovethehistogramshowstheaveragesizeofalltheshesinthe
histogram.ThevalueispresentedintheunityouhavechosenintheUnitsdialog.For
anaccuratex-axisvalue,placethecursoronaverticalbarinthehistogram,andread
thevaluefromthelabel.
TheabbreviationTSiscommonlyused.Itmeans“TargetStrength”,andthisisa
measureofhowstrongechotheindividualshesinthecurrentechogramgenerate.
Theechostrengthindicatesthesizeoftheshes.TheSizeDistributioninformation
panethusprovidesamathematicalestimateofthesizesofallthechosenshspeciesin
theechogram.
Thetargetstrengthfromashvariesfromspecietospecie.Tochangetheshspecies,
usetheFishSelectdialogopenedontheSetupmenu.
→FishSelectonpage191
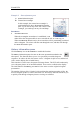
Parameters
1Fishspecies
Thecurrentshspecies,asselectedintheFishSelectdialog,isshown.
→FishSelectonpage191
2Echogram
Youcanseesizedistributionhistogramsfromthreedifferentsources.
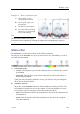
•UpperEchogram
Thishistogramiscreatedbasedonshechoesfromthetopechogramforthe
chosenchannel.Bydefault,thisisasurfaceechogram.
ThedataiscalculatedbasedontheselectionyouhavemadeintheCalculation
Intervaldialog.
•LowerEchogram
Thishistogramiscreatedbasedonshechoesfromthebottomechogramforthe
chosenchannel.Bydefault,thisisabottomechogram.
ThedataiscalculatedbasedontheselectionyouhavemadeintheCalculation
Intervaldialog.
Ifyouhaveselectedonlyasmallverticalrangeclosetobottom,thehistogram
maybeempty.Thisbecausetheshvolumeissmallduetothelimitedrange
selected,andbecausethetargetstrengthalgorithmmusttakeintoconsideration
otherbottomechoesthansh.
•Zoom
Thishistogramiscreatedbasedonshechoesfromthecurrentlyzoomedarea.
3Meanvalue
Thelargenumberaboveeachhistogramisthemeanvaluefromthetallestbar.The
unitreectsthemodechosenintheSizeDistributiondialog.
→SizeDistributiononpage231
Tochangethesettingsinthehistogram,clickSizeDistributionontheActivemenu.
338106/C
139