
Installation manual


SimradES70
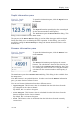
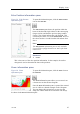
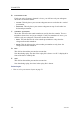
SizeDistributioninformationpane
Figure27SizeDistribution
informationpane
Toopenthisinformationpane,clicktheSize
DistributioniconontheTitleBar.
TheSizeDistributioninformationpaneshowsa
histogramofthesingleshechoesdetected.The
calculationisbasedontheparametersyouhave
selectedintheCalculationIntervaldialog;time,ping
orachosenpartofthecurrentview.Itthusprovides
avisualindicationonhowlargetheshesarewithin
thechoseninterval.
Onlytheshesdetectedbythecurrenttransducer
frequencyareshown.
Thelargenumberabovethehistogramshowsthe
averagesizeofalltheshesinthehistogram.The
valueispresentedintheunityouhavechoseninthe
Unitsdialog.Foranaccuratex-axisvalue,placethe
cursoronaverticalbarinthehistogram,andreadthevaluefromthelabel.
TheabbreviationTSiscommonlyused.Itmeans“TargetStrength”,andthisisa
measureofhowstrongechotheindividualshesinthecurrentechogramgenerate.
Theechostrengthindicatesthesizeoftheshes.TheSizeDistributioninformation
panethusprovidesamathematicalestimateofthesizesofallthechosenshspeciesin
theechogram.
Thetargetstrengthfromashvariesfromspecietospecie.Tochangetheshspecies,
usetheFishSelectdialogopenedontheSetupmenu.
Note
TheSizeDistributioninformationpaneisonlyavailableifyourES70isequippedwithone
ormoresplitbeamtransceivers.
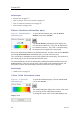
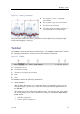
ThefollowinginformationisprovidedintheSizeDistributioninformationpane.
1Fishspecies:Thecurrentshspecies,asselectedintheFishSelectdialog,isshown.
2Echogram:Y oucanseesizedistributionhistogramsfromthreedifferentsources.
•UpperEchogram:Thishistogramiscreatedbasedonshechoesfromthetop
echogramforthechosenchannel.Bydefault,thisisasurfaceechogram.
ThedataiscalculatedbasedontheselectionyouhavemadeintheCalculation
Intervaldialog.
62
343539/B