
Installation manual

Displayviews
Biomassline
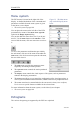
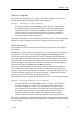
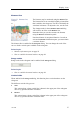
Figure21Biomassline,
example
ThebiomassmaybemonitoredusingtheBiomassline.
Thebiomasslineisanextrathickbrightlycolouredline
thatisaddedtotheechogram.Thelinewillidentifythe
variationsinbiomass.Toadjusttheview,usethescale.
ThechangesmadeintheCalculationIntervaldialog
willnothaveaneffectontheBiomassline.
Rememberthatyoucanalsomeasurethebiomass
usingtheBiomassinformationpanel.
Notethatbiomassisanoptionalfunction.Inorderto
activatetheBiomassinformationpane,youmustobtain
asoftwarelicence.
ThebiomasslineisenabledintheEchogramdialog.Youcanchangethescaleofthe
curvetottheverticalspaceavailableontheechogram.
Relatedtopics
→Biomassinformationpaneonpage59
→Howtoestablishhorizontalmarkersonpage84
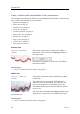
Rangescales
RangescalesintheechogramcanbeenabledintheEchogramdialog.
Relatedtopics
→Howtoestablishhorizontalmarkersonpage84
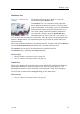
Verticalticks
WhenenabledintheEchogramdialog,thisfunctionplacesverticalmarkersonthe
echogram.
Thedifferentverticalticktypesare:
aTime
Thisoptionplacesashortverticallineisdrawnintheupperpartoftheechogram
onceeveryspeciednumberofminutes.
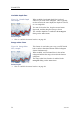
bDistance
Thisoptioninsertsashortverticallineisdrawnintheupperpartoftheechogram
onceeveryspeciednumberofnauticalmiles.
343539/B
57