
Installation manual

SimradES70
verticalrange(usingtheRangeandStartRangesettings),theresultingareaisusedfor
thebiomasscalculation.Iftheseabedisclearlydenedwithauniquebottomdetection,
thebottomechowilln
o t beincludedinthecalculations.Therefore,ifyouswitchthe
bottomdetectoroff,thebottomechowillbeincludedinthecalculation.
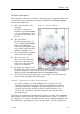
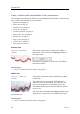
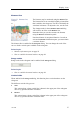
Bottomechogram
Thisechogramisrelatedtothedetectedbottom.Stopdepth(lowerechogramboundary)
andverticalrangearemanuallyselectedbytheStartDepthandRangebuttonsonthe
Mainmenu.Theechogramisonlydrawnforpingshavingasuccessfulbottomdetection.
Figure15Bottomechogram
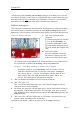
AThisisthestartdepthofthe
echogram.
Inabottomechogramitisnormally
itissetupwithStartRangeset
toarelativesmallnegativevalue.
Thevaluedeneshowmanymeter
abovethebottomtheechogramwill
start.
BThisisthebottom.
Sincetheechogramisrelatedto
thisbottom,itappearstobeat.
Fishesclosetothebottomisthen
easytosee.
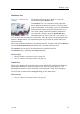
Therangefromthestartdepthabovethebottomanddowntosomedistancebelow
theactualbottomisdenedwiththeRangebuttonontheMainmenu.
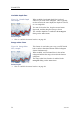
Example6StartRangeandRangeinbottomrelatedechogram
Inabottomechogram,settheStartRangevalueto–5meters.Thiswill
maketheechogramstartfrom5metersabovethebottom.SetRangeto
the5metersplus10=15meters.Theechogramwillnowshowthearea
from5metersabovethedepth,anddownto10meters“below”the
bottom.Thebottomcontourwillappearasaatline.
CThistextidentiesthetransducerusedtocreatetheechogram.
DThisisthescopeview.
Thisviewpresentsindividualcolourlines.Thecolourandlengthofeachline
reectsthereceivedechoamplitude.
EBydefault,the“pingtime”andthedepthrangeisshowninthebottomleftsideof
theechogram.Inthebottomrightcorner,the“pingtime”isthesameascurrent.
ThisinformationcanbechangedusingtheoptionsontheHorizontalAxistabinthe
Echogramdialog.
FThisisthelowerendofthedepthrange.Itisnormallyafewmetersbelowthe
bottomcontour,dependingonthechosenrange.
ThebiomasscalculationismadeinthesamewayasforSurfaceechograms.
52
343539/B