
User Manual

SGD-SB2025NT-TUM, Part 2
Jan 12 Page 70
SOLAR (SYNC) TIMING
packet buffering, therefore maintaining approximate synchronisation. This fallback mode of timing
is indicated by the text ‘NI’ where the ‘SV’ number is shown alongside the 1PPS status indication
(now showing
Red
failed) on the TM status panel.
7.5 T
IMING
D
IAGRAMS
If the user wishes to gain a deeper understanding of the Solar timing process and the selection of
the correct timing values, some timing diagrams have been produced. The diagrams show the
sequential events that occur when a 20 ms sample of an audio signal presented to the input of a
NI. This is processed within Solar then passed through the bearer network and ultimately re-
constituted into the original audio signal at the destination NI.
For the purposes of clarity, the Solar network shown has been restricted to a single Central NI and
two Station NIs. Neither do the diagrams show any network devices that will be interfacing
between each Solar unit and the network itself. Therefore, it may appear that Solar is being
connected at different network data rates whereas, in practice, it will only ever connect at
10/100 Mbs (the NI is always 10 Mbs) but the data will be transported at the rate determined by the
local network speed.
7.5.1 Dynamic Diagrams
A fully dynamic copy of the core timing diagram has been produced using Microsoft™ Visio™ and
is available on the Team Simoco website. This diagram allows variables about the network
characteristics to be entered and the resultant effects on Solar timing can be examined. Two
versions of the file are available: one in Visio 2005 format; and one in the earlier Visio 2002 format.
For those who do not have a copy of Visio, a Visio viewer is available from the Microsoft™ web
site. This will allow the diagrams to be displayed but may not allow access to the dynamic aspect
of the timing diagrams, which is the feature that is most useful.
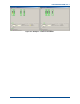
7.5.2 Operating the Visio Diagrams
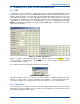
The Visio diagram has two pages: one for the “Go” path; and one for the “Return” path. Each page
operates independently from the other but they both basically function in the same manner. The
results of the parameters entered are summarised in the reports box, which is also fully dynamic.
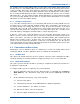
To change the parameters for each section of the network, right click on the text box displaying the
network information to open the menu list. The first menu item shown is for the NI parameters;
select that to open a data entry window, where a data rate may be selected and a delay value
entered. A network delay limit of 60 ms has been applied and, whilst it is possible to enter a higher
value, this will not be used and a notice of ‘Invalid Delay’ will be displayed. A range of network
connection speeds has been provided and the packet size changes according to the data rate,
which naturally impacts upon the network delay figure.
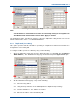
To make changes to the Solar setup parameters, right click on the background to open the page
menu. The first item in the menu list is ‘Solar Parameters’; select this to open the data entry
window. All entries for ‘Solar Parameters’ are from pull down lists, therefore, it is not possible to
enter an invalid value.
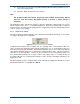
All shapes within the diagram have been protected to prevent the inadvertent movement of a
shape. If a shape is moved it will lose the relationship to the other shapes and the diagram will no
longer function correctly. If this situation should arise, since ‘Undo’ will not recover the severed
link, the best course of action is to delete the diagram and reload the file from the web site.