
User manual


...the world's most energy friendly microcontrollers
2012-04-24 - Giant Gecko Family - d0053_Rev0.96 26
www.energymicro.com
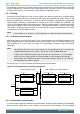
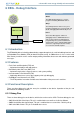
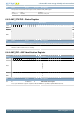
6 DBG - Debug Interface
0
1 2 3 4
ARM Cortex-M 3
DBG
Debug Data
Quick Facts
What?
The DBG (Debug Interface) is used to
program and debug EFM32GG devices.
Why?
The Debug Interface makes it easy to re-
program and update the system in field, and
allows debugging with minimal I/O pin use.
How?
The Cortex-M3 supports advanced
debugging features. EFM32GG devices
only use two port pins for debugging or
programming. The systems internal and
external state can be examined with debug
extensions supporting instruction or data
access break- and watch points.
6.1 Introduction
The EFM32GG devices include hardware debug support through a 2-pin serial-wire debug interface and
an Embedded Trace Module (ETM) for data/instruction tracing. In addition there is also a 1-wire Serial
Wire Viewer pin which can be used to output profiling information, data trace and software-generated
messages.
6.2 Features
• Flash Patch and Breakpoint (FPB) unit
• Implement breakpoints and code patches
• Data Watch point and Trace (DWT) unit
• Implement watch points, trigger resources, and system profiling
• Instrumentation Trace Macrocell (ITM)
• Application-driven trace source that supports printf style debugging
• Embedded Trace Macrocell v3.5 (ETM)
• The ETM provides instruction and data trace information of the processor in real time.
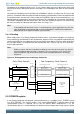
6.3 Functional Description
There are three debug pins and four trace pins available on the device. Operation of the pins are
described in the following sections.
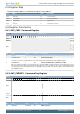
6.3.1 Debug Pins
There are three debug pins on the device, which also can be used as GPIO. The three debug pins are:
• SWCLK Serial Wire Clock input. This pin is enabled after reset and has a built-in pull down.
• SWDIO Serial Wire data Input/Output. This pin is enabled after a reset and has a built in pull-up.
• SWV Serial Wire Viewer. This pin is disabled after a reset.