Server series SIGNUM SYSTEMS CORPORATION GDB Server for ARM, XScale and Cortex User Manual
COPYRIGHT NOTICE Copyright (c) 2011 by Signum Systems Corporation. All rights are reserved worldwide. No part of this publication may be reproduced, transmitted, transcribed, stored in a retrieval system, or translated into any language or computer language, in any form or by any means, electronic, mechanical, magnetic, optical, chemical, manual, or otherwise, without the prior written permission of Signum Systems.
Table of Contents Preliminaries 1 License 1 Installation 2 Installation on Windows 2 Installation on Linux 2 Configuring the Server 3 Usage 3 Emulation Parameter File 5 Macro/Initialization Files 5 Board and CPU Customization 6 Loading to Flash 6 Configuring the Debugger 7 GNU GDB Debugger 7 Code Sourcery G++ IDE 8 Using GDB with the GDB Server 10 The GDB Monitor Command 10 Coprocessor and Peripheral Registers 11 Debugging Embedded Linux 13 i
GDB server Preliminaries SigGdbServer is an implementation ofthe GDB Server for the Signum JTAGjet emulator. It is used to debug ARM processors with GDB based debuggers on Windows systems. License The SigGdbServer server is designed for the use with the Signum JTAGjet emulator. This server-emulator tandem requires a license. If your emulator does not have it, an external license file must be obtained from Signum Systems. Once received, the Jxxxxx-Gdb.
SI GNUM S YS TE MS 8 3 0 Installation Installation on Windows To install the server package on a Windows system, execute the setup_siggdbserver.exe program. The default installation folder is C:\Signum\SigGdbServer. If a system-level JTAGjet USB driver has not yet been installed on your computer, the system will prompt you for the appropriate driver upon connecting the emulator to the USB port for the first time. Point the installation program to the Drivers\USB subfolder of the installation folder (e.g.
GDB SER VER FO R AR M, X SC AL E AN D COR TE X U S E R M A N U A L 2. Install the JTAGjet USB driver for Linux from the jtagjetdrv_-2.deb package: sudo dpkg --install jtagjetdrv_1.2-2.deb. Detailed instructions are in the jtagjetdrv_README.txt file. Install USBDiag from the USBDiag_.tar archive. Detailed instructions are in the USBDiag_README.txt file. In a directory of your choice, unpack SigGdbServer for Linux from the SigGdbServer-1.07.03.tar.gz tarball.
SI GNUM S YS TE MS 8 3 0 -no-flash-write - RAM for the flash programmer, 16k@0x0. - Restrict flash write to context defined by commands monitor flash before-load and monitor flash after-load. Examples CONNECT TO THE IMX31 PROCESSOR (VERBOSE VERSION) sigGdbServer -emu iMX31.par -init iMX31.ini CONNECT TO THE IMX31 PROCESSOR sigGdbServer -cpu iMX31 -init This is a short version of the previous command line. The processor is specified using the –cpu iMX31 option. The emulation parameter file iMX31.
GDB SER VER FO R AR M, X SC AL E AN D COR TE X U S E R M A N U A L Emulation Parameter File The core and CPU dependent emulation parameters are stored in the .par file used in conjunction with the -emu option. These parameters are a subset of the parameter list displayed by the Chameleon emu command. Refer to the .par files provided with the package for guidelines for determining which of these parameters are essential to the operation of the server. If the server package includes a .
SI GNUM S YS TE MS 8 3 0 You cannot use Chameleon’s startup macro as is. However, most Chameleon macros can be modified for the use with the GDB server. Note: Board and CPU Customization Connecting to custom-made boards and processors involves the following steps. 1. 2. 3. Appropriately modify the emulation parameter file specified in the -emu option. If Chameleon Debugger is connected to the CPU, some of the parameters returned by the emu command may need to be stored in this file.
GDB SER VER FO R AR M, X SC AL E AN D COR TE X U S E R M A N U A L Configuring the Debugger GNU GDB Debugger Start the GDB server as described in the Configuring the Server section (page 3). The server should report a successful connection to the target processor. C:\Signum\SigGdbServer>SigGdbServer -cpu iMX31 -reg iMX31 -init SigGdbServer Version 1.07 (C) Signum Systems Corp. 2006-2010 Starting ... OK - Connected to the emulator ... Found boards/iMX31.par file ...
SI GNUM S YS TE MS 8 3 0 Loading section ..rodata, size 0x29 lma 0x9f10 Loading section .data, size 0x850 lma 0xa03c Loading section .ctors, size 0x8 lma 0xa88c Loading section ..dtors, size 0x8 lma 0xa894 Start address 0x8000, load size 10137 Transfer rate: 81096 bits in <1 sec, 151 bytes/write. (gdb) p /x $pc $1 = 0x8000 (gdb) break main Breakpoint 1 at 0x8220: file x.c, line 34. (gdb) c Continuing. Breakpoint 1, main () at x.c:34 34 a = 0; ...
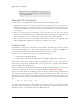
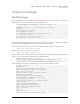
GDB SER VER FO R AR M, X SC AL E AN D COR TE X U S E R M A N U A L FIGURE 1 Creating a new debug configuration. In the dialog box, select the Sourcery G++ Debug and press the New button to create a new configuration. 2. In the newly created “Debug with JTAGjet” configuration, open the Debugger tab. In the Debugger drop-down menu, select Sourcery G++ External Embedded Server for ARM EABI.
SI GNUM S YS TE MS 8 3 0 5. To start a new debugging session, from the debug history list, select the debug configuration you created—in our example, “Debug with JTAGjet”—or open the Debug Configuration dialog box by selecting Debug Configuration from the Debug As option in the project popup menu. Press the Debug button. Using GDB with the GDB Server The GDB Monitor Command SigGdbServer provides the following commands for sending special requests to the GDB server.
GDB SER VER FO R AR M, X SC AL E AN D COR TE X U S E R M A N U A L (gdb) monitor –d stop (gdb) # Reset, wait 100ms, then stop. (gdb) cont See also an example of the delayed monitor command use in the chapter. Debugging Embedded Linux Coprocessor and Peripheral Registers The GDB server provides access to the ARM coprocessor registers and memory mapped peripheral registers.
SI GNUM S YS TE MS 8 3 0 Coprocessor Registers Coprocessor registers are defined for a core rather than a processor. The register description comes from the cores\.def file which has the same format as the peripheral registers file. In our iMX31 processor (ARM1136J-S core) example, the register description is taken from the core\ARM1136J-S.def file. You should avoid modifying this file. The CP structure contains the definition of the coprocessor register.
GDB SER VER FO R AR M, X SC AL E AN D COR TE X U S E R M A N U A L Debugging Embedded Linux This is an example of loading a Linux kernel to RAM. ... (gdb) # Reset the processor and stop it. (gdb) # Use the delayed (-d option) monitor command (gdb) # that will be executed by the next 'continue'. (gdb) monitor -d reset /halt Command delayed. (gdb) c Continuing. (gdb) # Set a breakpoint at the kernel entry point. (gdb) hbreak *0x90008000 Hardware assisted breakpoint 5 at 0x90008000 (gdb) c Continuing.
SI GNUM S YS TE MS 8 3 0 (gdb) (gdb) $12 = (gdb) (gdb) $13 = # machid p /x $r1 0x84d # boot args p /x $r2 0x90000100 (gdb) # Set a hardware breakpoint at start_kernel(). (gdb) hbreak start_kernel Hardware assisted breakpoint 6 at 0xc00087b0: file init/main.c, line 547. (gdb) c Continuing. Breakpoint 6, start_kernel () at init/main.c:547 547 in init/main.c (gdb) p /x $pc $14 = 0xc00087b0 (gdb) # The virtual memory is initialized. We can debug the kernel now. ...